Immigrants from Pakistan vs Yuman Seniors Poverty Over the Age of 75
COMPARE
Immigrants from Pakistan
Yuman
Seniors Poverty Over the Age of 75
Seniors Poverty Over the Age of 75 Comparison
Immigrants from Pakistan
Yuman
12.0%
SENIORS POVERTY OVER THE AGE OF 75
71.9/ 100
METRIC RATING
140th/ 347
METRIC RANK
15.4%
SENIORS POVERTY OVER THE AGE OF 75
0.0/ 100
METRIC RATING
296th/ 347
METRIC RANK
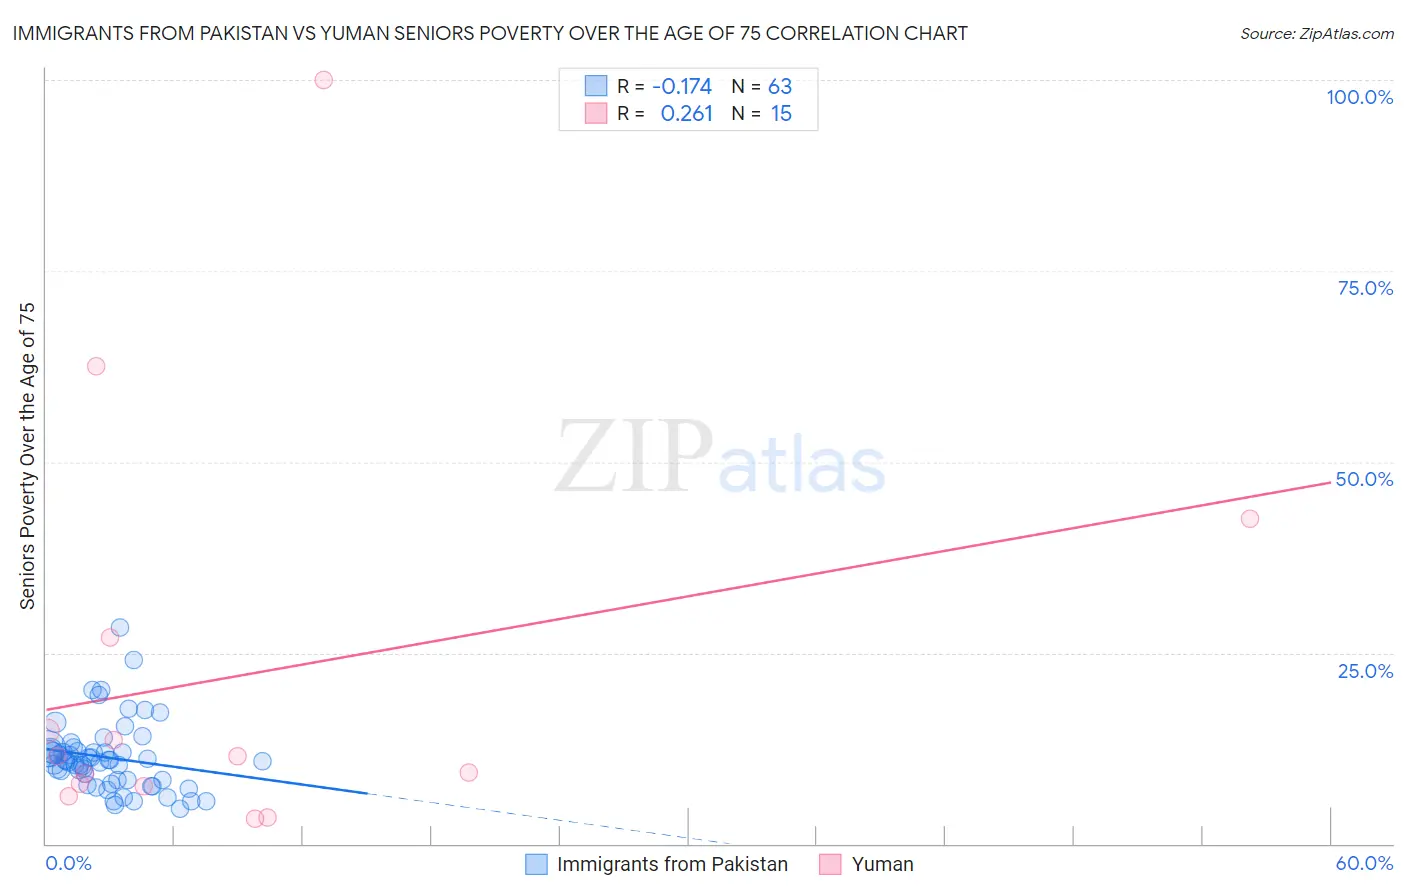
Immigrants from Pakistan vs Yuman Seniors Poverty Over the Age of 75 Correlation Chart
The statistical analysis conducted on geographies consisting of 281,562,225 people shows a poor negative correlation between the proportion of Immigrants from Pakistan and poverty level among seniors over the age of 75 in the United States with a correlation coefficient (R) of -0.174 and weighted average of 12.0%. Similarly, the statistical analysis conducted on geographies consisting of 40,581,367 people shows a weak positive correlation between the proportion of Yuman and poverty level among seniors over the age of 75 in the United States with a correlation coefficient (R) of 0.261 and weighted average of 15.4%, a difference of 28.8%.
Seniors Poverty Over the Age of 75 Correlation Summary
| Measurement | Immigrants from Pakistan | Yuman |
| Minimum | 4.6% | 3.3% |
| Maximum | 28.2% | 100.0% |
| Range | 23.6% | 96.7% |
| Mean | 11.3% | 22.0% |
| Median | 10.8% | 11.5% |
| Interquartile 25% (IQ1) | 8.3% | 7.6% |
| Interquartile 75% (IQ3) | 12.3% | 27.0% |
| Interquartile Range (IQR) | 4.0% | 19.4% |
| Standard Deviation (Sample) | 4.5% | 27.0% |
| Standard Deviation (Population) | 4.5% | 26.1% |
Similar Demographics by Seniors Poverty Over the Age of 75
Demographics Similar to Immigrants from Pakistan by Seniors Poverty Over the Age of 75
In terms of seniors poverty over the age of 75, the demographic groups most similar to Immigrants from Pakistan are Immigrants from Cameroon (12.0%, a difference of 0.020%), Immigrants from Laos (12.0%, a difference of 0.040%), Immigrants from Kenya (11.9%, a difference of 0.070%), Immigrants from Romania (11.9%, a difference of 0.080%), and American (12.0%, a difference of 0.090%).
| Demographics | Rating | Rank | Seniors Poverty Over the Age of 75 |
| Immigrants | Sierra Leone | 77.6 /100 | #133 | Good 11.9% |
| Ugandans | 77.1 /100 | #134 | Good 11.9% |
| Immigrants | Ireland | 76.2 /100 | #135 | Good 11.9% |
| Immigrants | Philippines | 75.0 /100 | #136 | Good 11.9% |
| Immigrants | Moldova | 74.1 /100 | #137 | Good 11.9% |
| Immigrants | Romania | 72.6 /100 | #138 | Good 11.9% |
| Immigrants | Kenya | 72.6 /100 | #139 | Good 11.9% |
| Immigrants | Pakistan | 71.9 /100 | #140 | Good 12.0% |
| Immigrants | Cameroon | 71.7 /100 | #141 | Good 12.0% |
| Immigrants | Laos | 71.5 /100 | #142 | Good 12.0% |
| Americans | 71.0 /100 | #143 | Good 12.0% |
| Hmong | 70.8 /100 | #144 | Good 12.0% |
| Immigrants | Belgium | 70.8 /100 | #145 | Good 12.0% |
| Bangladeshis | 70.4 /100 | #146 | Good 12.0% |
| Immigrants | Latvia | 69.1 /100 | #147 | Good 12.0% |
Demographics Similar to Yuman by Seniors Poverty Over the Age of 75
In terms of seniors poverty over the age of 75, the demographic groups most similar to Yuman are U.S. Virgin Islander (15.4%, a difference of 0.18%), Honduran (15.4%, a difference of 0.28%), Immigrants from Jamaica (15.3%, a difference of 0.37%), Native/Alaskan (15.5%, a difference of 0.62%), and Spanish American Indian (15.5%, a difference of 0.72%).
| Demographics | Rating | Rank | Seniors Poverty Over the Age of 75 |
| Immigrants | Belize | 0.0 /100 | #289 | Tragic 15.2% |
| Immigrants | Azores | 0.0 /100 | #290 | Tragic 15.2% |
| Paiute | 0.0 /100 | #291 | Tragic 15.2% |
| Colville | 0.0 /100 | #292 | Tragic 15.2% |
| Apache | 0.0 /100 | #293 | Tragic 15.3% |
| Immigrants | Jamaica | 0.0 /100 | #294 | Tragic 15.3% |
| U.S. Virgin Islanders | 0.0 /100 | #295 | Tragic 15.4% |
| Yuman | 0.0 /100 | #296 | Tragic 15.4% |
| Hondurans | 0.0 /100 | #297 | Tragic 15.4% |
| Natives/Alaskans | 0.0 /100 | #298 | Tragic 15.5% |
| Spanish American Indians | 0.0 /100 | #299 | Tragic 15.5% |
| Bahamians | 0.0 /100 | #300 | Tragic 15.5% |
| Immigrants | Latin America | 0.0 /100 | #301 | Tragic 15.6% |
| West Indians | 0.0 /100 | #302 | Tragic 15.7% |
| Immigrants | Honduras | 0.0 /100 | #303 | Tragic 15.7% |