Immigrants from Pakistan vs Czech Seniors Poverty Over the Age of 75
COMPARE
Immigrants from Pakistan
Czech
Seniors Poverty Over the Age of 75
Seniors Poverty Over the Age of 75 Comparison
Immigrants from Pakistan
Czechs
12.0%
SENIORS POVERTY OVER THE AGE OF 75
71.9/ 100
METRIC RATING
140th/ 347
METRIC RANK
10.5%
SENIORS POVERTY OVER THE AGE OF 75
99.9/ 100
METRIC RATING
20th/ 347
METRIC RANK
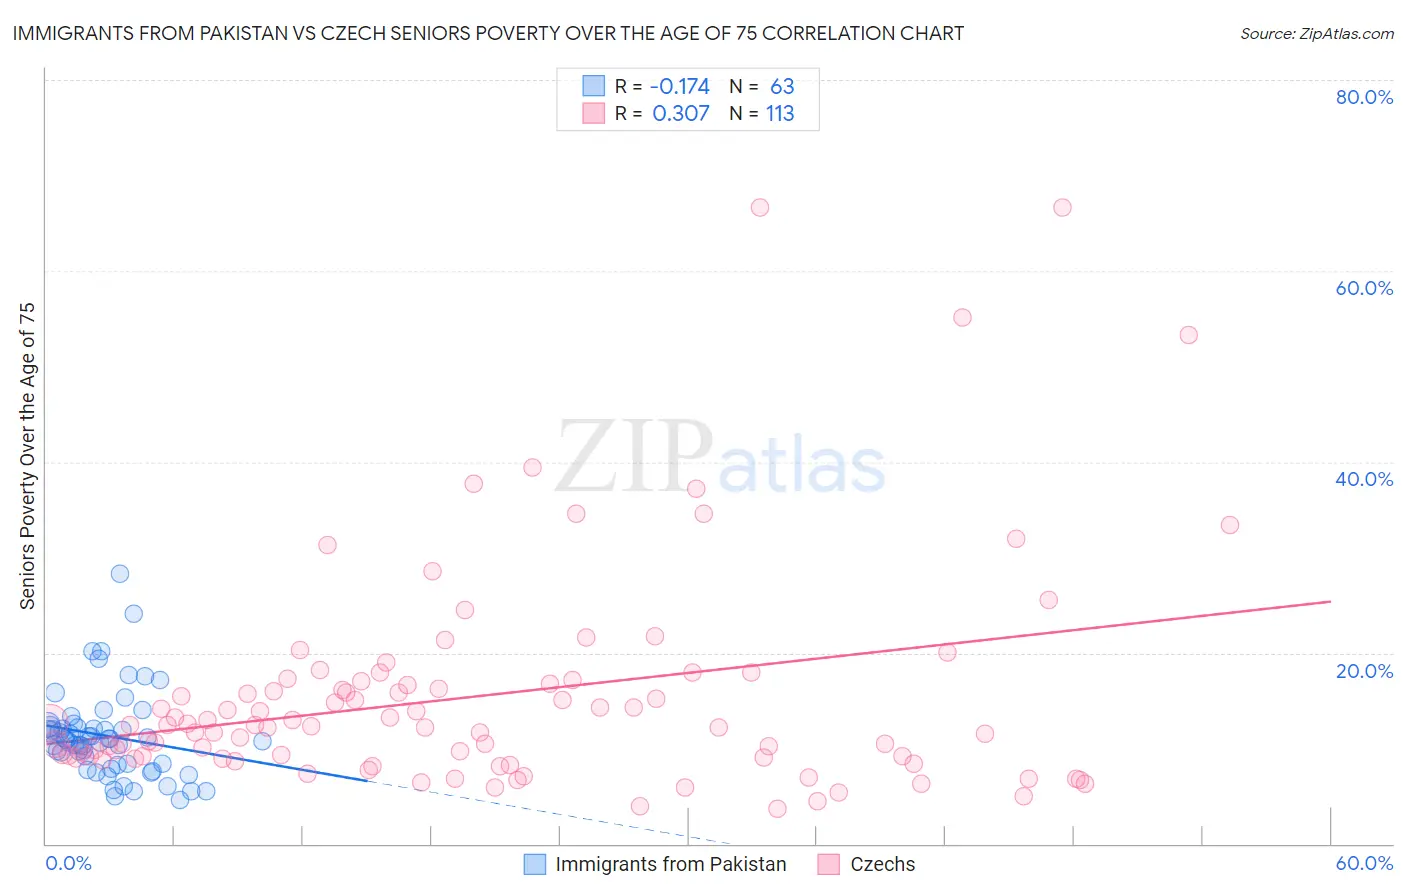
Immigrants from Pakistan vs Czech Seniors Poverty Over the Age of 75 Correlation Chart
The statistical analysis conducted on geographies consisting of 281,562,225 people shows a poor negative correlation between the proportion of Immigrants from Pakistan and poverty level among seniors over the age of 75 in the United States with a correlation coefficient (R) of -0.174 and weighted average of 12.0%. Similarly, the statistical analysis conducted on geographies consisting of 475,172,256 people shows a mild positive correlation between the proportion of Czechs and poverty level among seniors over the age of 75 in the United States with a correlation coefficient (R) of 0.307 and weighted average of 10.5%, a difference of 13.3%.
Seniors Poverty Over the Age of 75 Correlation Summary
| Measurement | Immigrants from Pakistan | Czech |
| Minimum | 4.6% | 3.7% |
| Maximum | 28.2% | 66.7% |
| Range | 23.6% | 63.0% |
| Mean | 11.3% | 15.5% |
| Median | 10.8% | 12.3% |
| Interquartile 25% (IQ1) | 8.3% | 9.0% |
| Interquartile 75% (IQ3) | 12.3% | 16.9% |
| Interquartile Range (IQR) | 4.0% | 7.9% |
| Standard Deviation (Sample) | 4.5% | 11.5% |
| Standard Deviation (Population) | 4.5% | 11.5% |
Similar Demographics by Seniors Poverty Over the Age of 75
Demographics Similar to Immigrants from Pakistan by Seniors Poverty Over the Age of 75
In terms of seniors poverty over the age of 75, the demographic groups most similar to Immigrants from Pakistan are Immigrants from Cameroon (12.0%, a difference of 0.020%), Immigrants from Laos (12.0%, a difference of 0.040%), Immigrants from Kenya (11.9%, a difference of 0.070%), Immigrants from Romania (11.9%, a difference of 0.080%), and American (12.0%, a difference of 0.090%).
| Demographics | Rating | Rank | Seniors Poverty Over the Age of 75 |
| Immigrants | Sierra Leone | 77.6 /100 | #133 | Good 11.9% |
| Ugandans | 77.1 /100 | #134 | Good 11.9% |
| Immigrants | Ireland | 76.2 /100 | #135 | Good 11.9% |
| Immigrants | Philippines | 75.0 /100 | #136 | Good 11.9% |
| Immigrants | Moldova | 74.1 /100 | #137 | Good 11.9% |
| Immigrants | Romania | 72.6 /100 | #138 | Good 11.9% |
| Immigrants | Kenya | 72.6 /100 | #139 | Good 11.9% |
| Immigrants | Pakistan | 71.9 /100 | #140 | Good 12.0% |
| Immigrants | Cameroon | 71.7 /100 | #141 | Good 12.0% |
| Immigrants | Laos | 71.5 /100 | #142 | Good 12.0% |
| Americans | 71.0 /100 | #143 | Good 12.0% |
| Hmong | 70.8 /100 | #144 | Good 12.0% |
| Immigrants | Belgium | 70.8 /100 | #145 | Good 12.0% |
| Bangladeshis | 70.4 /100 | #146 | Good 12.0% |
| Immigrants | Latvia | 69.1 /100 | #147 | Good 12.0% |
Demographics Similar to Czechs by Seniors Poverty Over the Age of 75
In terms of seniors poverty over the age of 75, the demographic groups most similar to Czechs are Immigrants from Scotland (10.5%, a difference of 0.020%), Slovene (10.6%, a difference of 0.040%), Welsh (10.5%, a difference of 0.050%), Slovak (10.5%, a difference of 0.060%), and Dutch (10.5%, a difference of 0.26%).
| Demographics | Rating | Rank | Seniors Poverty Over the Age of 75 |
| Croatians | 99.9 /100 | #13 | Exceptional 10.5% |
| Scottish | 99.9 /100 | #14 | Exceptional 10.5% |
| Europeans | 99.9 /100 | #15 | Exceptional 10.5% |
| Dutch | 99.9 /100 | #16 | Exceptional 10.5% |
| Slovaks | 99.9 /100 | #17 | Exceptional 10.5% |
| Welsh | 99.9 /100 | #18 | Exceptional 10.5% |
| Immigrants | Scotland | 99.9 /100 | #19 | Exceptional 10.5% |
| Czechs | 99.9 /100 | #20 | Exceptional 10.5% |
| Slovenes | 99.9 /100 | #21 | Exceptional 10.6% |
| Bhutanese | 99.8 /100 | #22 | Exceptional 10.6% |
| Lithuanians | 99.8 /100 | #23 | Exceptional 10.6% |
| Poles | 99.8 /100 | #24 | Exceptional 10.6% |
| Menominee | 99.8 /100 | #25 | Exceptional 10.6% |
| Bulgarians | 99.8 /100 | #26 | Exceptional 10.7% |
| Northern Europeans | 99.8 /100 | #27 | Exceptional 10.7% |