Immigrants from Pakistan vs Czech 3rd Grade
COMPARE
Immigrants from Pakistan
Czech
3rd Grade
3rd Grade Comparison
Immigrants from Pakistan
Czechs
97.5%
3RD GRADE
2.7/ 100
METRIC RATING
230th/ 347
METRIC RANK
98.4%
3RD GRADE
100.0/ 100
METRIC RATING
31st/ 347
METRIC RANK
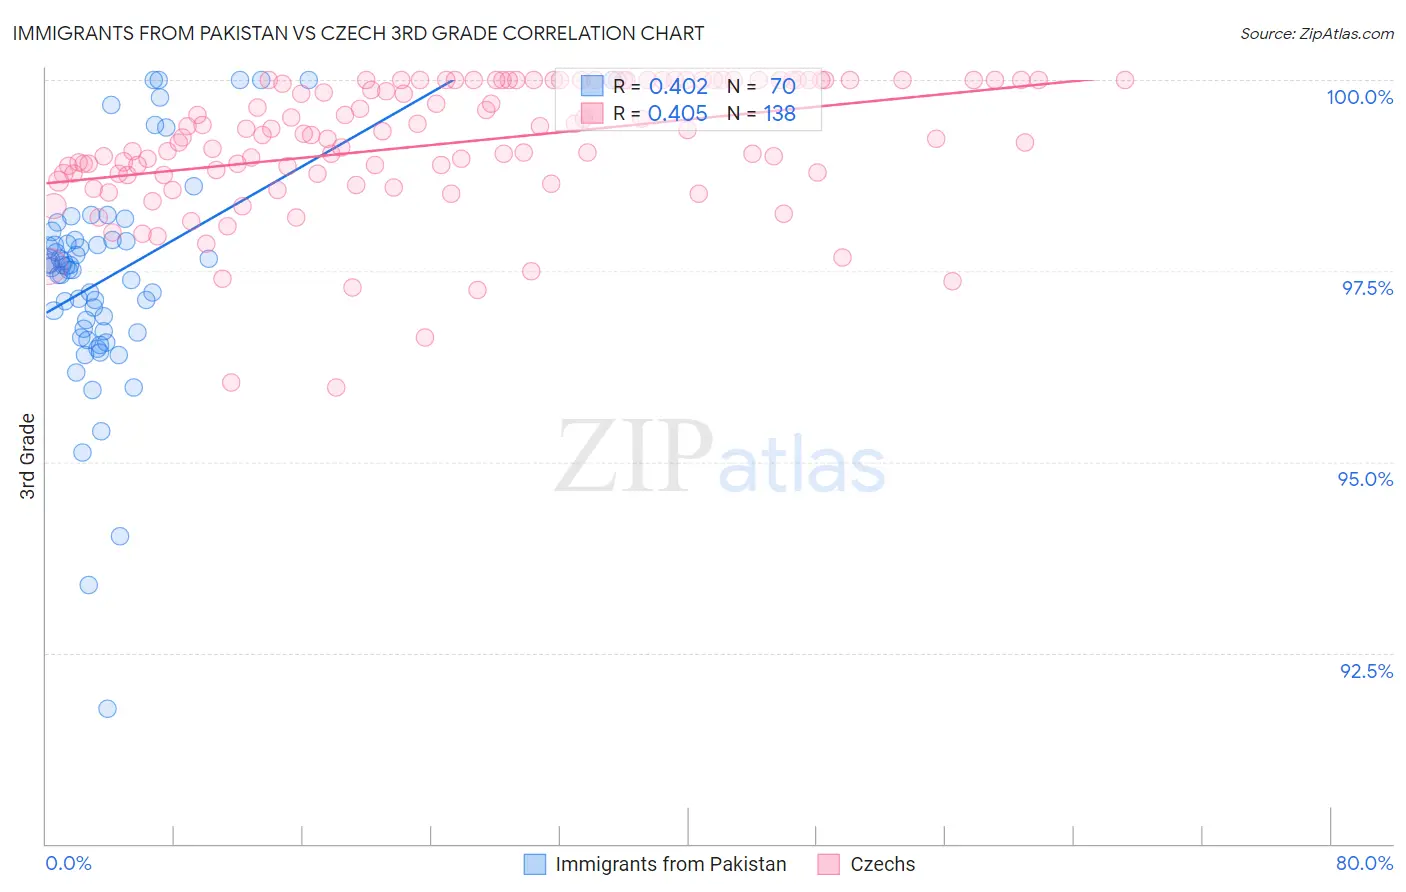
Immigrants from Pakistan vs Czech 3rd Grade Correlation Chart
The statistical analysis conducted on geographies consisting of 283,900,606 people shows a moderate positive correlation between the proportion of Immigrants from Pakistan and percentage of population with at least 3rd grade education in the United States with a correlation coefficient (R) of 0.402 and weighted average of 97.5%. Similarly, the statistical analysis conducted on geographies consisting of 484,813,102 people shows a moderate positive correlation between the proportion of Czechs and percentage of population with at least 3rd grade education in the United States with a correlation coefficient (R) of 0.405 and weighted average of 98.4%, a difference of 1.0%.
3rd Grade Correlation Summary
| Measurement | Immigrants from Pakistan | Czech |
| Minimum | 91.8% | 96.0% |
| Maximum | 100.0% | 100.0% |
| Range | 8.2% | 4.0% |
| Mean | 97.4% | 99.2% |
| Median | 97.6% | 99.3% |
| Interquartile 25% (IQ1) | 96.7% | 98.8% |
| Interquartile 75% (IQ3) | 97.9% | 100.0% |
| Interquartile Range (IQR) | 1.2% | 1.2% |
| Standard Deviation (Sample) | 1.5% | 0.85% |
| Standard Deviation (Population) | 1.5% | 0.85% |
Similar Demographics by 3rd Grade
Demographics Similar to Immigrants from Pakistan by 3rd Grade
In terms of 3rd grade, the demographic groups most similar to Immigrants from Pakistan are Immigrants from Costa Rica (97.5%, a difference of 0.0%), Subsaharan African (97.5%, a difference of 0.010%), Senegalese (97.5%, a difference of 0.010%), Immigrants from Western Asia (97.5%, a difference of 0.010%), and Immigrants from Malaysia (97.5%, a difference of 0.010%).
| Demographics | Rating | Rank | 3rd Grade |
| Immigrants | Syria | 4.4 /100 | #223 | Tragic 97.5% |
| Bahamians | 4.4 /100 | #224 | Tragic 97.5% |
| Tongans | 4.3 /100 | #225 | Tragic 97.5% |
| Sudanese | 4.1 /100 | #226 | Tragic 97.5% |
| Immigrants | Sudan | 3.4 /100 | #227 | Tragic 97.5% |
| Sub-Saharan Africans | 3.2 /100 | #228 | Tragic 97.5% |
| Senegalese | 3.0 /100 | #229 | Tragic 97.5% |
| Immigrants | Pakistan | 2.7 /100 | #230 | Tragic 97.5% |
| Immigrants | Costa Rica | 2.7 /100 | #231 | Tragic 97.5% |
| Immigrants | Western Asia | 2.6 /100 | #232 | Tragic 97.5% |
| Immigrants | Malaysia | 2.4 /100 | #233 | Tragic 97.5% |
| Immigrants | Eastern Asia | 1.9 /100 | #234 | Tragic 97.4% |
| Immigrants | Iraq | 1.8 /100 | #235 | Tragic 97.4% |
| Liberians | 1.8 /100 | #236 | Tragic 97.4% |
| Colombians | 1.8 /100 | #237 | Tragic 97.4% |
Demographics Similar to Czechs by 3rd Grade
In terms of 3rd grade, the demographic groups most similar to Czechs are European (98.4%, a difference of 0.0%), Scandinavian (98.4%, a difference of 0.0%), French (98.4%, a difference of 0.010%), French Canadian (98.4%, a difference of 0.010%), and Croatian (98.5%, a difference of 0.020%).
| Demographics | Rating | Rank | 3rd Grade |
| Danes | 100.0 /100 | #24 | Exceptional 98.5% |
| Scotch-Irish | 100.0 /100 | #25 | Exceptional 98.5% |
| Aleuts | 100.0 /100 | #26 | Exceptional 98.5% |
| Croatians | 100.0 /100 | #27 | Exceptional 98.5% |
| French | 100.0 /100 | #28 | Exceptional 98.4% |
| French Canadians | 100.0 /100 | #29 | Exceptional 98.4% |
| Europeans | 100.0 /100 | #30 | Exceptional 98.4% |
| Czechs | 100.0 /100 | #31 | Exceptional 98.4% |
| Scandinavians | 100.0 /100 | #32 | Exceptional 98.4% |
| Chinese | 100.0 /100 | #33 | Exceptional 98.4% |
| Swiss | 100.0 /100 | #34 | Exceptional 98.4% |
| Arapaho | 100.0 /100 | #35 | Exceptional 98.4% |
| British | 99.9 /100 | #36 | Exceptional 98.4% |
| Italians | 99.9 /100 | #37 | Exceptional 98.4% |
| Chippewa | 99.9 /100 | #38 | Exceptional 98.4% |