Immigrants from Northern Europe vs Immigrants from North Macedonia Unemployment Among Ages 16 to 19 years
COMPARE
Immigrants from Northern Europe
Immigrants from North Macedonia
Unemployment Among Ages 16 to 19 years
Unemployment Among Ages 16 to 19 years Comparison
Immigrants from Northern Europe
Immigrants from North Macedonia
17.4%
UNEMPLOYMENT AMONG AGES 16 TO 19 YEARS
72.5/ 100
METRIC RATING
150th/ 347
METRIC RANK
16.4%
UNEMPLOYMENT AMONG AGES 16 TO 19 YEARS
99.7/ 100
METRIC RATING
46th/ 347
METRIC RANK
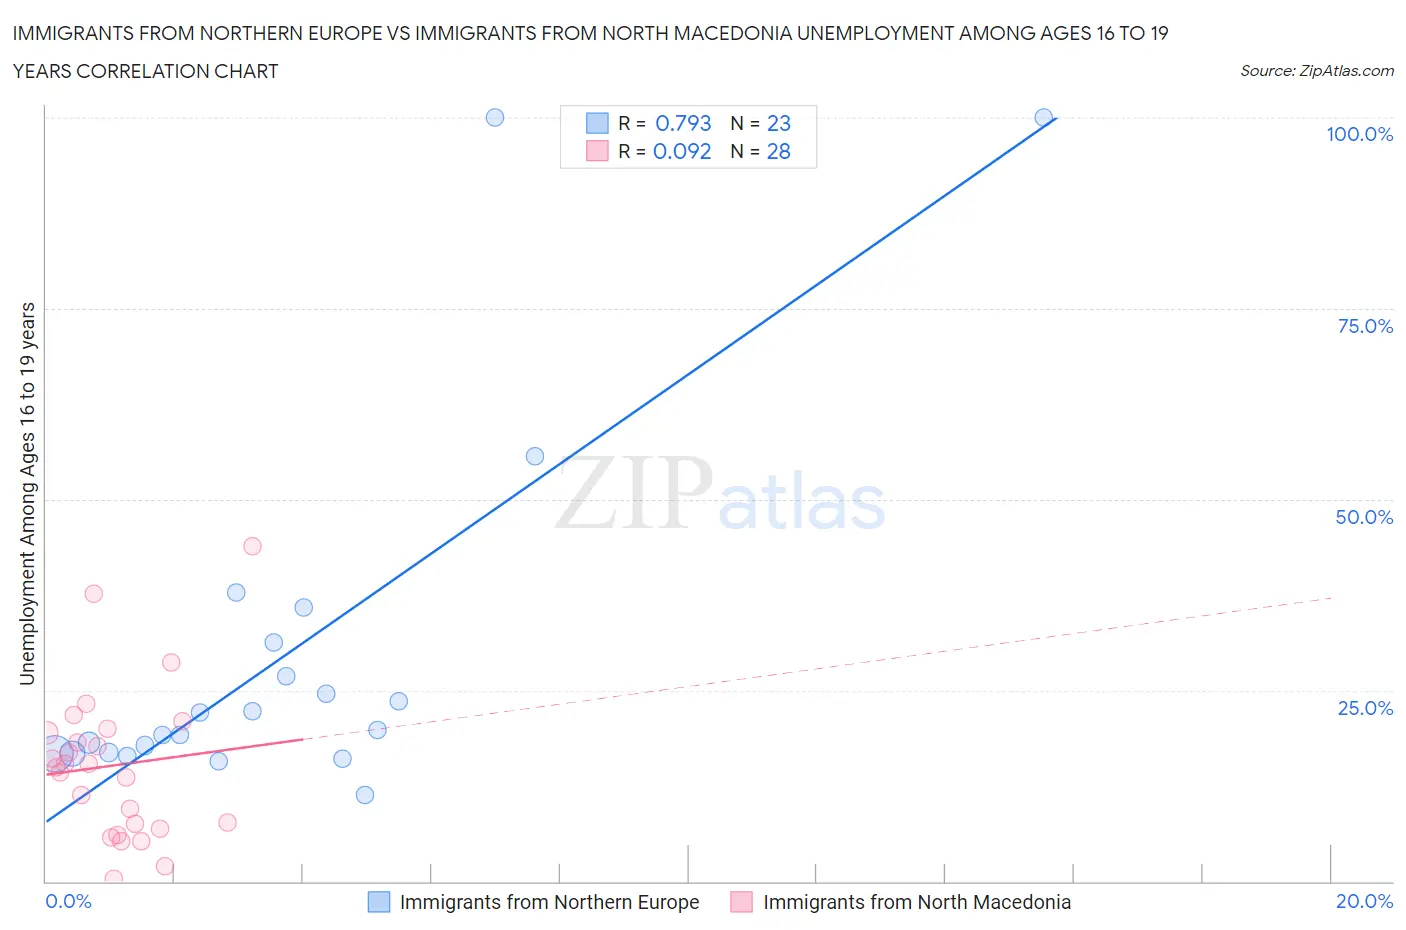
Immigrants from Northern Europe vs Immigrants from North Macedonia Unemployment Among Ages 16 to 19 years Correlation Chart
The statistical analysis conducted on geographies consisting of 443,364,808 people shows a strong positive correlation between the proportion of Immigrants from Northern Europe and unemployment rate among population between the ages 16 and 19 in the United States with a correlation coefficient (R) of 0.793 and weighted average of 17.4%. Similarly, the statistical analysis conducted on geographies consisting of 72,836,955 people shows a slight positive correlation between the proportion of Immigrants from North Macedonia and unemployment rate among population between the ages 16 and 19 in the United States with a correlation coefficient (R) of 0.092 and weighted average of 16.4%, a difference of 6.2%.
Unemployment Among Ages 16 to 19 years Correlation Summary
| Measurement | Immigrants from Northern Europe | Immigrants from North Macedonia |
| Minimum | 11.4% | 0.40% |
| Maximum | 100.0% | 43.9% |
| Range | 88.6% | 43.5% |
| Mean | 29.7% | 15.2% |
| Median | 19.8% | 15.1% |
| Interquartile 25% (IQ1) | 16.8% | 7.2% |
| Interquartile 75% (IQ3) | 31.3% | 19.7% |
| Interquartile Range (IQR) | 14.6% | 12.5% |
| Standard Deviation (Sample) | 24.2% | 10.0% |
| Standard Deviation (Population) | 23.6% | 9.8% |
Similar Demographics by Unemployment Among Ages 16 to 19 years
Demographics Similar to Immigrants from Northern Europe by Unemployment Among Ages 16 to 19 years
In terms of unemployment among ages 16 to 19 years, the demographic groups most similar to Immigrants from Northern Europe are Immigrants from Eastern Asia (17.4%, a difference of 0.080%), Romanian (17.3%, a difference of 0.15%), Immigrants from Hong Kong (17.4%, a difference of 0.19%), Immigrants from Northern Africa (17.4%, a difference of 0.21%), and Tsimshian (17.3%, a difference of 0.22%).
| Demographics | Rating | Rank | Unemployment Among Ages 16 to 19 years |
| Immigrants | Egypt | 79.1 /100 | #143 | Good 17.3% |
| Immigrants | England | 78.9 /100 | #144 | Good 17.3% |
| Indians (Asian) | 77.6 /100 | #145 | Good 17.3% |
| Turks | 77.1 /100 | #146 | Good 17.3% |
| Tsimshian | 76.0 /100 | #147 | Good 17.3% |
| Romanians | 74.9 /100 | #148 | Good 17.3% |
| Immigrants | Eastern Asia | 73.8 /100 | #149 | Good 17.4% |
| Immigrants | Northern Europe | 72.5 /100 | #150 | Good 17.4% |
| Immigrants | Hong Kong | 69.3 /100 | #151 | Good 17.4% |
| Immigrants | Northern Africa | 69.0 /100 | #152 | Good 17.4% |
| Immigrants | Afghanistan | 68.6 /100 | #153 | Good 17.4% |
| Afghans | 68.1 /100 | #154 | Good 17.4% |
| Portuguese | 67.3 /100 | #155 | Good 17.4% |
| Costa Ricans | 65.9 /100 | #156 | Good 17.4% |
| Uruguayans | 64.3 /100 | #157 | Good 17.5% |
Demographics Similar to Immigrants from North Macedonia by Unemployment Among Ages 16 to 19 years
In terms of unemployment among ages 16 to 19 years, the demographic groups most similar to Immigrants from North Macedonia are Polish (16.4%, a difference of 0.020%), Immigrants from Zimbabwe (16.3%, a difference of 0.040%), Immigrants from Vietnam (16.4%, a difference of 0.070%), Maltese (16.4%, a difference of 0.11%), and Immigrants from Lebanon (16.3%, a difference of 0.16%).
| Demographics | Rating | Rank | Unemployment Among Ages 16 to 19 years |
| Croatians | 99.8 /100 | #39 | Exceptional 16.3% |
| Hmong | 99.8 /100 | #40 | Exceptional 16.3% |
| Immigrants | Nepal | 99.8 /100 | #41 | Exceptional 16.3% |
| Fijians | 99.8 /100 | #42 | Exceptional 16.3% |
| Immigrants | Lebanon | 99.8 /100 | #43 | Exceptional 16.3% |
| Immigrants | Zimbabwe | 99.7 /100 | #44 | Exceptional 16.3% |
| Poles | 99.7 /100 | #45 | Exceptional 16.4% |
| Immigrants | North Macedonia | 99.7 /100 | #46 | Exceptional 16.4% |
| Immigrants | Vietnam | 99.7 /100 | #47 | Exceptional 16.4% |
| Maltese | 99.7 /100 | #48 | Exceptional 16.4% |
| Iraqis | 99.7 /100 | #49 | Exceptional 16.4% |
| Bhutanese | 99.6 /100 | #50 | Exceptional 16.4% |
| Lebanese | 99.6 /100 | #51 | Exceptional 16.4% |
| Welsh | 99.6 /100 | #52 | Exceptional 16.4% |
| Slovenes | 99.6 /100 | #53 | Exceptional 16.4% |