Immigrants from North Macedonia vs Guatemalan Female Poverty
COMPARE
Immigrants from North Macedonia
Guatemalan
Female Poverty
Female Poverty Comparison
Immigrants from North Macedonia
Guatemalans
11.7%
FEMALE POVERTY
99.6/ 100
METRIC RATING
29th/ 347
METRIC RANK
16.7%
FEMALE POVERTY
0.0/ 100
METRIC RATING
301st/ 347
METRIC RANK
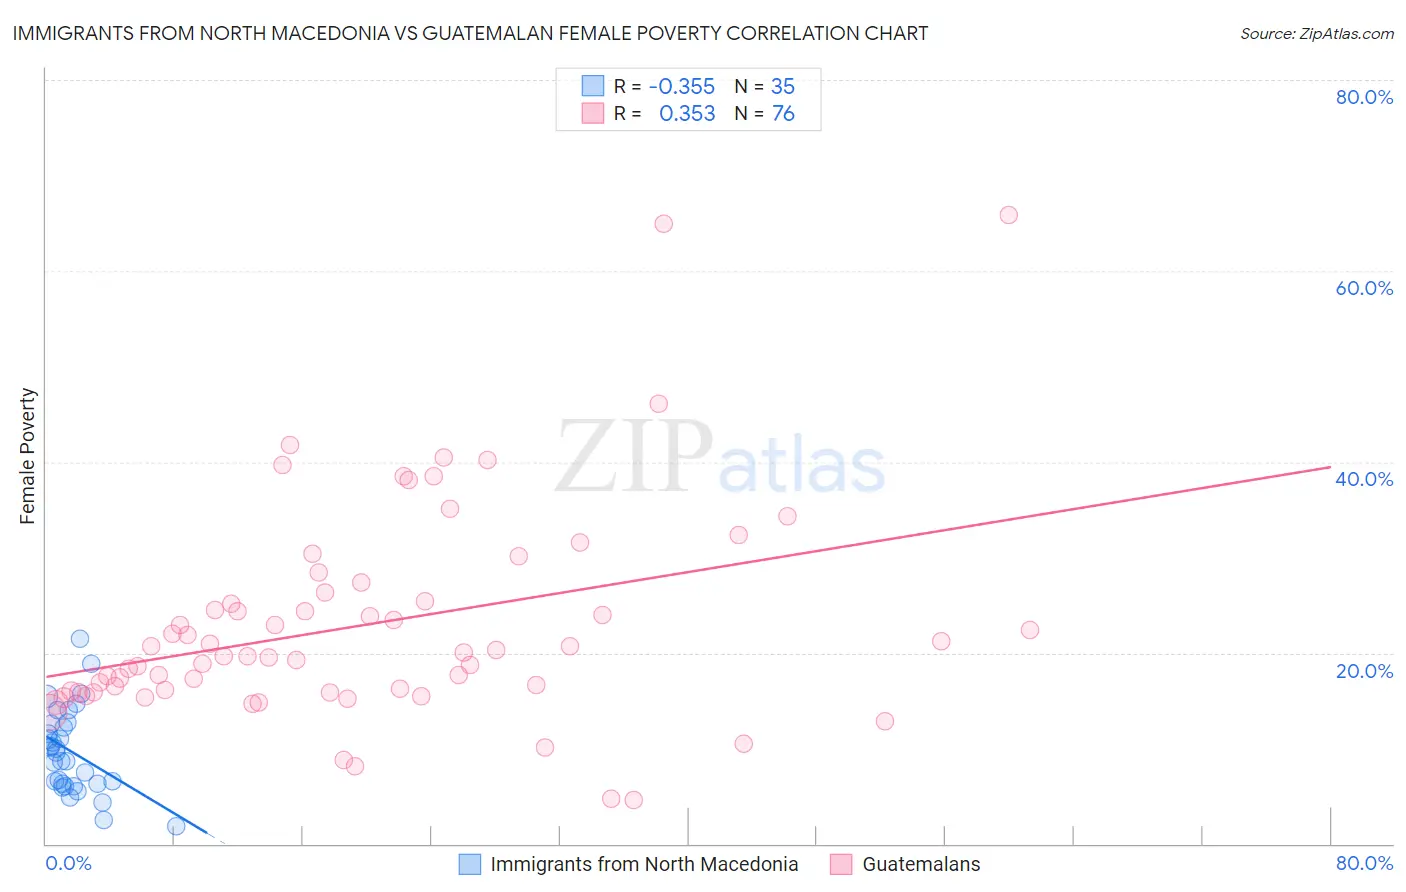
Immigrants from North Macedonia vs Guatemalan Female Poverty Correlation Chart
The statistical analysis conducted on geographies consisting of 74,287,962 people shows a mild negative correlation between the proportion of Immigrants from North Macedonia and poverty level among females in the United States with a correlation coefficient (R) of -0.355 and weighted average of 11.7%. Similarly, the statistical analysis conducted on geographies consisting of 409,219,734 people shows a mild positive correlation between the proportion of Guatemalans and poverty level among females in the United States with a correlation coefficient (R) of 0.353 and weighted average of 16.7%, a difference of 42.8%.
Female Poverty Correlation Summary
| Measurement | Immigrants from North Macedonia | Guatemalan |
| Minimum | 1.8% | 4.6% |
| Maximum | 21.5% | 65.8% |
| Range | 19.7% | 61.2% |
| Mean | 9.7% | 22.9% |
| Median | 9.6% | 19.8% |
| Interquartile 25% (IQ1) | 6.3% | 15.9% |
| Interquartile 75% (IQ3) | 12.6% | 25.8% |
| Interquartile Range (IQR) | 6.3% | 9.9% |
| Standard Deviation (Sample) | 4.4% | 11.3% |
| Standard Deviation (Population) | 4.4% | 11.2% |
Similar Demographics by Female Poverty
Demographics Similar to Immigrants from North Macedonia by Female Poverty
In terms of female poverty, the demographic groups most similar to Immigrants from North Macedonia are Greek (11.7%, a difference of 0.080%), Immigrants from Korea (11.7%, a difference of 0.15%), Polish (11.7%, a difference of 0.30%), Iranian (11.7%, a difference of 0.36%), and Danish (11.7%, a difference of 0.43%).
| Demographics | Rating | Rank | Female Poverty |
| Swedes | 99.7 /100 | #22 | Exceptional 11.6% |
| Burmese | 99.7 /100 | #23 | Exceptional 11.6% |
| Luxembourgers | 99.7 /100 | #24 | Exceptional 11.6% |
| Immigrants | Northern Europe | 99.6 /100 | #25 | Exceptional 11.6% |
| Croatians | 99.6 /100 | #26 | Exceptional 11.6% |
| Iranians | 99.6 /100 | #27 | Exceptional 11.7% |
| Immigrants | Korea | 99.6 /100 | #28 | Exceptional 11.7% |
| Immigrants | North Macedonia | 99.6 /100 | #29 | Exceptional 11.7% |
| Greeks | 99.5 /100 | #30 | Exceptional 11.7% |
| Poles | 99.5 /100 | #31 | Exceptional 11.7% |
| Danes | 99.5 /100 | #32 | Exceptional 11.7% |
| Cypriots | 99.5 /100 | #33 | Exceptional 11.8% |
| Immigrants | Singapore | 99.4 /100 | #34 | Exceptional 11.8% |
| Immigrants | Iran | 99.4 /100 | #35 | Exceptional 11.8% |
| Immigrants | Pakistan | 99.4 /100 | #36 | Exceptional 11.8% |
Demographics Similar to Guatemalans by Female Poverty
In terms of female poverty, the demographic groups most similar to Guatemalans are Chippewa (16.7%, a difference of 0.030%), Bahamian (16.6%, a difference of 0.33%), Hispanic or Latino (16.6%, a difference of 0.38%), Choctaw (16.8%, a difference of 0.63%), and Immigrants from Central America (16.8%, a difference of 0.70%).
| Demographics | Rating | Rank | Female Poverty |
| Immigrants | Cabo Verde | 0.0 /100 | #294 | Tragic 16.4% |
| Senegalese | 0.0 /100 | #295 | Tragic 16.5% |
| Immigrants | Senegal | 0.0 /100 | #296 | Tragic 16.5% |
| Mexicans | 0.0 /100 | #297 | Tragic 16.5% |
| Somalis | 0.0 /100 | #298 | Tragic 16.6% |
| Hispanics or Latinos | 0.0 /100 | #299 | Tragic 16.6% |
| Bahamians | 0.0 /100 | #300 | Tragic 16.6% |
| Guatemalans | 0.0 /100 | #301 | Tragic 16.7% |
| Chippewa | 0.0 /100 | #302 | Tragic 16.7% |
| Choctaw | 0.0 /100 | #303 | Tragic 16.8% |
| Immigrants | Central America | 0.0 /100 | #304 | Tragic 16.8% |
| Immigrants | Grenada | 0.0 /100 | #305 | Tragic 16.8% |
| Immigrants | Caribbean | 0.0 /100 | #306 | Tragic 16.9% |
| Seminole | 0.0 /100 | #307 | Tragic 16.9% |
| Africans | 0.0 /100 | #308 | Tragic 16.9% |