Immigrants from Kuwait vs Guatemalan Female Poverty
COMPARE
Immigrants from Kuwait
Guatemalan
Female Poverty
Female Poverty Comparison
Immigrants from Kuwait
Guatemalans
13.7%
FEMALE POVERTY
32.7/ 100
METRIC RATING
191st/ 347
METRIC RANK
16.7%
FEMALE POVERTY
0.0/ 100
METRIC RATING
301st/ 347
METRIC RANK
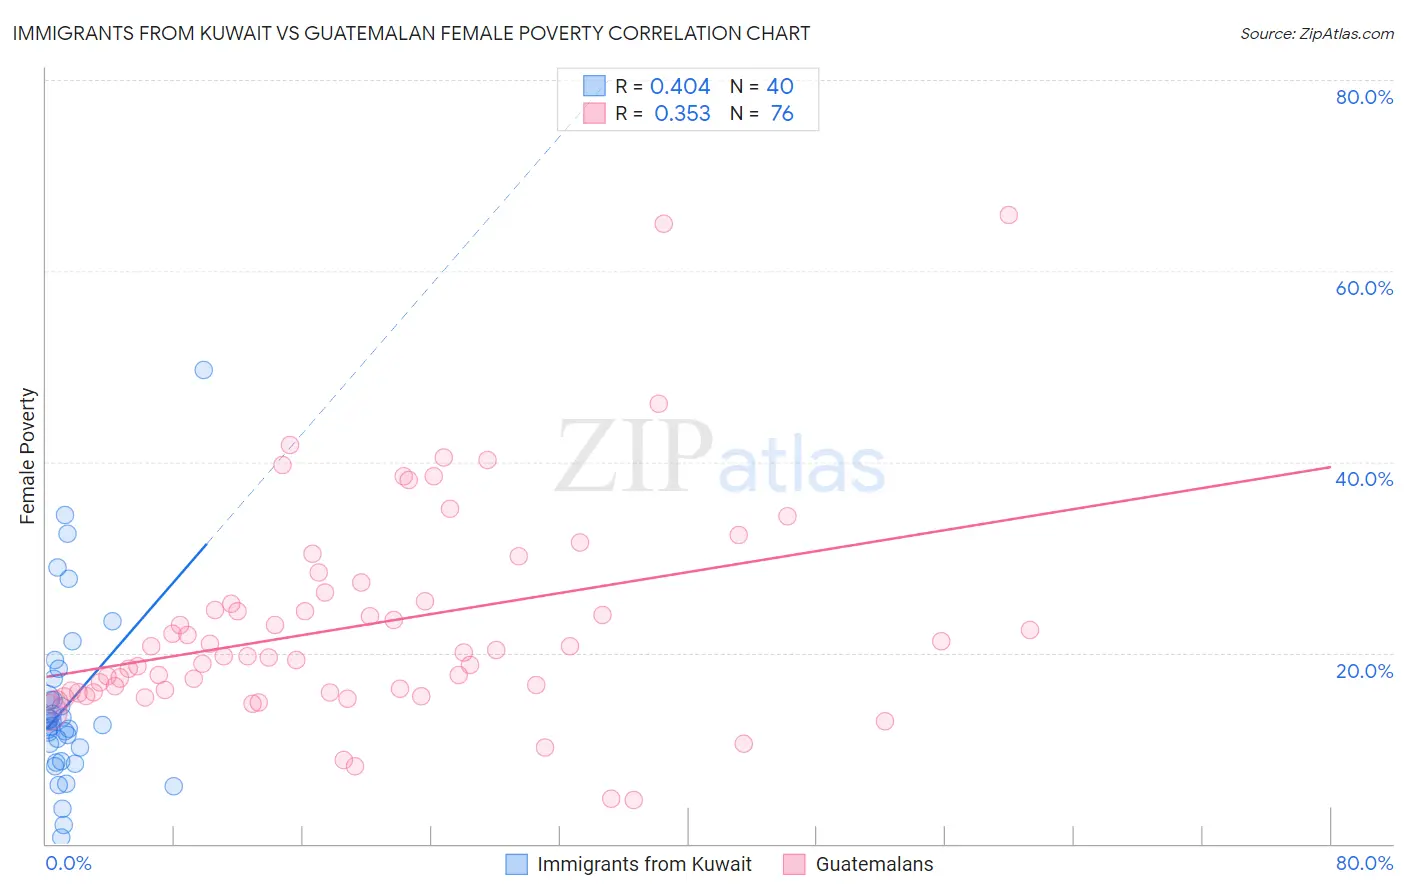
Immigrants from Kuwait vs Guatemalan Female Poverty Correlation Chart
The statistical analysis conducted on geographies consisting of 136,883,256 people shows a moderate positive correlation between the proportion of Immigrants from Kuwait and poverty level among females in the United States with a correlation coefficient (R) of 0.404 and weighted average of 13.7%. Similarly, the statistical analysis conducted on geographies consisting of 409,219,734 people shows a mild positive correlation between the proportion of Guatemalans and poverty level among females in the United States with a correlation coefficient (R) of 0.353 and weighted average of 16.7%, a difference of 22.1%.
Female Poverty Correlation Summary
| Measurement | Immigrants from Kuwait | Guatemalan |
| Minimum | 0.62% | 4.6% |
| Maximum | 49.6% | 65.8% |
| Range | 49.0% | 61.2% |
| Mean | 14.6% | 22.9% |
| Median | 12.6% | 19.8% |
| Interquartile 25% (IQ1) | 9.3% | 15.9% |
| Interquartile 75% (IQ3) | 16.3% | 25.8% |
| Interquartile Range (IQR) | 7.0% | 9.9% |
| Standard Deviation (Sample) | 9.4% | 11.3% |
| Standard Deviation (Population) | 9.3% | 11.2% |
Similar Demographics by Female Poverty
Demographics Similar to Immigrants from Kuwait by Female Poverty
In terms of female poverty, the demographic groups most similar to Immigrants from Kuwait are Sierra Leonean (13.7%, a difference of 0.040%), Immigrants from Costa Rica (13.7%, a difference of 0.090%), Iraqi (13.7%, a difference of 0.10%), Delaware (13.7%, a difference of 0.17%), and Immigrants from South America (13.7%, a difference of 0.23%).
| Demographics | Rating | Rank | Female Poverty |
| Immigrants | Sierra Leone | 43.2 /100 | #184 | Average 13.5% |
| Immigrants | Cameroon | 42.0 /100 | #185 | Average 13.5% |
| Immigrants | Portugal | 41.5 /100 | #186 | Average 13.6% |
| Immigrants | Venezuela | 41.0 /100 | #187 | Average 13.6% |
| Hawaiians | 39.9 /100 | #188 | Fair 13.6% |
| Uruguayans | 39.8 /100 | #189 | Fair 13.6% |
| Sierra Leoneans | 33.1 /100 | #190 | Fair 13.7% |
| Immigrants | Kuwait | 32.7 /100 | #191 | Fair 13.7% |
| Immigrants | Costa Rica | 31.9 /100 | #192 | Fair 13.7% |
| Iraqis | 31.8 /100 | #193 | Fair 13.7% |
| Delaware | 31.1 /100 | #194 | Fair 13.7% |
| Immigrants | South America | 30.6 /100 | #195 | Fair 13.7% |
| South American Indians | 28.9 /100 | #196 | Fair 13.7% |
| Arabs | 28.6 /100 | #197 | Fair 13.7% |
| Immigrants | Uganda | 28.5 /100 | #198 | Fair 13.7% |
Demographics Similar to Guatemalans by Female Poverty
In terms of female poverty, the demographic groups most similar to Guatemalans are Chippewa (16.7%, a difference of 0.030%), Bahamian (16.6%, a difference of 0.33%), Hispanic or Latino (16.6%, a difference of 0.38%), Choctaw (16.8%, a difference of 0.63%), and Immigrants from Central America (16.8%, a difference of 0.70%).
| Demographics | Rating | Rank | Female Poverty |
| Immigrants | Cabo Verde | 0.0 /100 | #294 | Tragic 16.4% |
| Senegalese | 0.0 /100 | #295 | Tragic 16.5% |
| Immigrants | Senegal | 0.0 /100 | #296 | Tragic 16.5% |
| Mexicans | 0.0 /100 | #297 | Tragic 16.5% |
| Somalis | 0.0 /100 | #298 | Tragic 16.6% |
| Hispanics or Latinos | 0.0 /100 | #299 | Tragic 16.6% |
| Bahamians | 0.0 /100 | #300 | Tragic 16.6% |
| Guatemalans | 0.0 /100 | #301 | Tragic 16.7% |
| Chippewa | 0.0 /100 | #302 | Tragic 16.7% |
| Choctaw | 0.0 /100 | #303 | Tragic 16.8% |
| Immigrants | Central America | 0.0 /100 | #304 | Tragic 16.8% |
| Immigrants | Grenada | 0.0 /100 | #305 | Tragic 16.8% |
| Immigrants | Caribbean | 0.0 /100 | #306 | Tragic 16.9% |
| Seminole | 0.0 /100 | #307 | Tragic 16.9% |
| Africans | 0.0 /100 | #308 | Tragic 16.9% |