Immigrants from Netherlands vs Somali Female Poverty Among 18-24 Year Olds

COMPARE

Immigrants from Netherlands
Race
Ancestry
AfghanAfricanAlaska NativeAlaskan AthabascanAlbanianAleutAlsatianAmericanApacheArabArapahoArgentineanArmenianAssyrian/Chaldean/SyriacAustralianAustrianBahamianBangladeshiBarbadianBasqueBelgianBelizeanBermudanBhutaneseBlackfeetBolivianBrazilianBritishBritish West IndianBulgarianBurmeseCajunCambodianCanadianCape VerdeanCarpatho RusynCelticCentral AmericanCentral American IndianCherokeeCheyenneChickasawChileanChineseChippewaChoctawColombianColvilleComancheCosta RicanCreeCreekCroatianCrowCubanCypriotCzechCzechoslovakianDanishDelawareDominicanDutchDutch West IndianEastern EuropeanEcuadorianEgyptianEnglishEstonianEthiopianEuropeanFijianFilipinoFinnishFrenchFrench American IndianFrench CanadianGermanGerman RussianGhanaianGreekGuamanian/ChamorroGuatemalanGuyaneseHaitianHmongHonduranHopiHoumaHungarianIcelanderIndian (Asian)IndonesianInupiatIranianIraqiIrishIroquoisIsraeliItalianJamaicanJapaneseJordanianKenyanKiowaKoreanLaotianLatvianLebaneseLiberianLithuanianLumbeeLuxembourgerMacedonianMalaysianMalteseMarshalleseMenomineeMexicanMexican American IndianMongolianMoroccanNative HawaiianNavajoNepaleseNew ZealanderNicaraguanNigerianNorthern EuropeanNorwegianOkinawanOsageOttawaPaiutePakistaniPalestinianPanamanianParaguayanPennsylvania GermanPeruvianPimaPolishPortuguesePotawatomiPuebloPuerto RicanPuget Sound SalishRomanianRussianSalvadoranSamoanScandinavianScotch-IrishScottishSeminoleSenegaleseSerbianShoshoneSierra LeoneanSiouxSlavicSlovakSloveneSouth AfricanSouth AmericanSouth American IndianSoviet UnionSpaniardSpanishSpanish AmericanSpanish American IndianSri LankanSubsaharan AfricanSudaneseSwedishSwissSyrianTaiwaneseThaiTlingit-HaidaTohono O'OdhamTonganTrinidadian and TobagonianTsimshianTurkishU.S. Virgin IslanderUgandanUkrainianUruguayanUteVenezuelanVietnameseWelshWest IndianYakamaYaquiYugoslavianYumanYup'ikZimbabwean
Immigration
NonimmigrantsImmigrantsAfghanistanAfricaAlbaniaArgentinaArmeniaAsiaAustraliaAustriaBahamasBangladeshBarbadosBelarusBelgiumBelizeBoliviaBosnia and HerzegovinaBrazilBulgariaBurma/MyanmarCabo VerdeCambodiaCameroonCanadaCaribbeanCentral AmericaChileChinaColombiaCongoCosta RicaCroatiaCubaCzechoslovakiaDenmarkDominicaDominican RepublicEastern AfricaEastern AsiaEastern EuropeEcuadorEgyptEl SalvadorEnglandEritreaEthiopiaEuropeFijiFranceGermanyGhanaGreeceGrenadaGuatemalaGuyanaHaitiHondurasHong KongHungaryIndiaIndonesiaIranIraqIrelandIsraelItalyJamaicaJapanJordanKazakhstanKenyaKoreaKuwaitLaosLatin AmericaLatviaLebanonLiberiaLithuaniaMalaysiaMexicoMicronesiaMiddle AfricaMoldovaMoroccoNepalNetherlandsNicaraguaNigeriaNorth AmericaNorth MacedoniaNorthern AfricaNorthern EuropeNorwayOceaniaPakistanPanamaPeruPhilippinesPolandPortugalRomaniaRussiaSaudi ArabiaScotlandSenegalSerbiaSierra LeoneSingaporeSomaliaSouth AfricaSouth AmericaSouth Central AsiaSouth Eastern AsiaSouthern EuropeSpainSri LankaSt. Vincent and the GrenadinesSudanSwedenSwitzerlandSyriaTaiwanThailandTrinidad and TobagoTurkeyUgandaUkraineUruguayUzbekistanVenezuelaVietnamWest IndiesWestern AfricaWestern AsiaWestern EuropeYemenZaireZimbabweAzores
Somali
Race
Ancestry
AfghanAfricanAlaska NativeAlaskan AthabascanAlbanianAleutAlsatianAmericanApacheArabArapahoArgentineanArmenianAssyrian/Chaldean/SyriacAustralianAustrianBahamianBangladeshiBarbadianBasqueBelgianBelizeanBermudanBhutaneseBlackfeetBolivianBrazilianBritishBritish West IndianBulgarianBurmeseCajunCambodianCanadianCape VerdeanCarpatho RusynCelticCentral AmericanCentral American IndianCherokeeCheyenneChickasawChileanChineseChippewaChoctawColombianColvilleComancheCosta RicanCreeCreekCroatianCrowCubanCypriotCzechCzechoslovakianDanishDelawareDominicanDutchDutch West IndianEastern EuropeanEcuadorianEgyptianEnglishEstonianEthiopianEuropeanFijianFilipinoFinnishFrenchFrench American IndianFrench CanadianGermanGerman RussianGhanaianGreekGuamanian/ChamorroGuatemalanGuyaneseHaitianHmongHonduranHopiHoumaHungarianIcelanderIndian (Asian)IndonesianInupiatIranianIraqiIrishIroquoisIsraeliItalianJamaicanJapaneseJordanianKenyanKiowaKoreanLaotianLatvianLebaneseLiberianLithuanianLumbeeLuxembourgerMacedonianMalaysianMalteseMarshalleseMenomineeMexicanMexican American IndianMongolianMoroccanNative HawaiianNavajoNepaleseNew ZealanderNicaraguanNigerianNorthern EuropeanNorwegianOkinawanOsageOttawaPaiutePakistaniPalestinianPanamanianParaguayanPennsylvania GermanPeruvianPimaPolishPortuguesePotawatomiPuebloPuerto RicanPuget Sound SalishRomanianRussianSalvadoranSamoanScandinavianScotch-IrishScottishSeminoleSenegaleseSerbianShoshoneSierra LeoneanSiouxSlavicSlovakSloveneSomaliSouth AfricanSouth AmericanSouth American IndianSoviet UnionSpaniardSpanishSpanish AmericanSpanish American IndianSri LankanSubsaharan AfricanSudaneseSwedishSwissSyrianTaiwaneseThaiTlingit-HaidaTohono O'OdhamTonganTrinidadian and TobagonianTsimshianTurkishU.S. Virgin IslanderUgandanUkrainianUruguayanUteVenezuelanVietnameseWelshWest IndianYakamaYaquiYugoslavianYumanYup'ikZimbabwean
Immigration
NonimmigrantsImmigrantsAfghanistanAfricaAlbaniaArgentinaArmeniaAsiaAustraliaAustriaBahamasBangladeshBarbadosBelarusBelgiumBelizeBoliviaBosnia and HerzegovinaBrazilBulgariaBurma/MyanmarCabo VerdeCambodiaCameroonCanadaCaribbeanCentral AmericaChileChinaColombiaCongoCosta RicaCroatiaCubaCzechoslovakiaDenmarkDominicaDominican RepublicEastern AfricaEastern AsiaEastern EuropeEcuadorEgyptEl SalvadorEnglandEritreaEthiopiaEuropeFijiFranceGermanyGhanaGreeceGrenadaGuatemalaGuyanaHaitiHondurasHong KongHungaryIndiaIndonesiaIranIraqIrelandIsraelItalyJamaicaJapanJordanKazakhstanKenyaKoreaKuwaitLaosLatin AmericaLatviaLebanonLiberiaLithuaniaMalaysiaMexicoMicronesiaMiddle AfricaMoldovaMoroccoNepalNicaraguaNigeriaNorth AmericaNorth MacedoniaNorthern AfricaNorthern EuropeNorwayOceaniaPakistanPanamaPeruPhilippinesPolandPortugalRomaniaRussiaSaudi ArabiaScotlandSenegalSerbiaSierra LeoneSingaporeSomaliaSouth AfricaSouth AmericaSouth Central AsiaSouth Eastern AsiaSouthern EuropeSpainSri LankaSt. Vincent and the GrenadinesSudanSwedenSwitzerlandSyriaTaiwanThailandTrinidad and TobagoTurkeyUgandaUkraineUruguayUzbekistanVenezuelaVietnamWest IndiesWestern AfricaWestern AsiaWestern EuropeYemenZaireZimbabweAzores
Female Poverty Among 18-24 Year Olds
Income
Poverty
Unemployment
Labor Participation
Family Structure
Vehicle Availability
Education Level
Disability

Female Poverty Among 18-24 Year Olds Comparison

Immigrants from Netherlands

Somalis

Poor
Tragic
20.5%
FEMALE POVERTY AMONG 18-24 YEAR OLDS
17.0/ 100
METRIC RATING
204th/ 347
METRIC RANK
25.1%
FEMALE POVERTY AMONG 18-24 YEAR OLDS
0.0/ 100
METRIC RATING
322nd/ 347
METRIC RANK

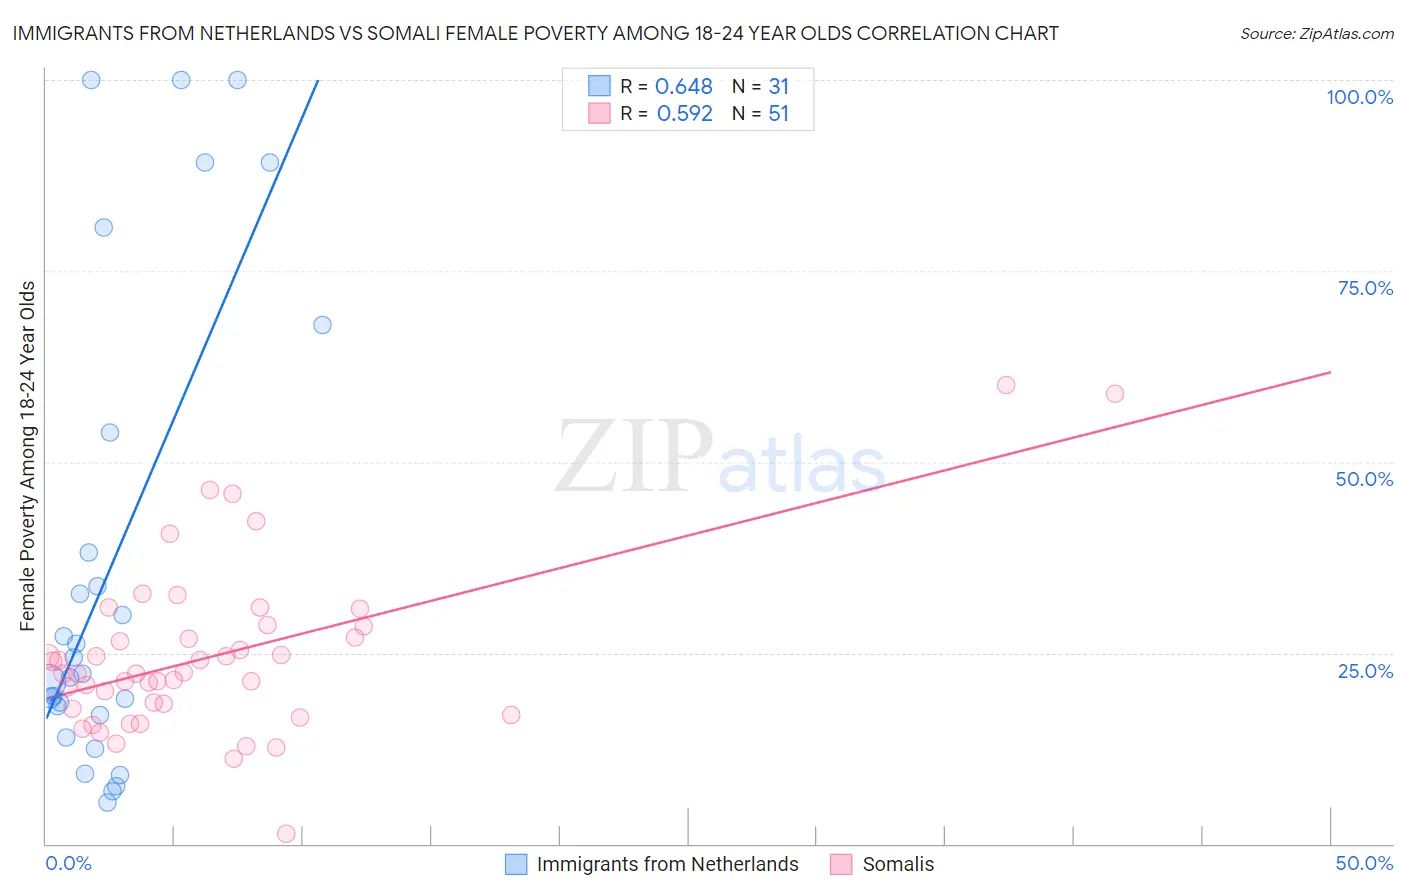
Immigrants from Netherlands vs Somali Female Poverty Among 18-24 Year Olds Correlation Chart

The statistical analysis conducted on geographies consisting of 233,588,287 people shows a significant positive correlation between the proportion of Immigrants from Netherlands and poverty level among females between the ages 18 and 24 in the United States with a correlation coefficient (R) of 0.648 and weighted average of 20.5%. Similarly, the statistical analysis conducted on geographies consisting of 98,981,198 people shows a substantial positive correlation between the proportion of Somalis and poverty level among females between the ages 18 and 24 in the United States with a correlation coefficient (R) of 0.592 and weighted average of 25.1%, a difference of 22.7%.
Immigrants from Netherlands vs Somali Female Poverty Among 18-24 Year Olds

Female Poverty Among 18-24 Year Olds Correlation Summary

MeasurementImmigrants from NetherlandsSomali
Minimum5.4%1.4%
Maximum100.0%60.0%
Range94.6%58.6%
Mean36.6%24.7%
Median22.3%22.3%
Interquartile 25% (IQ1)16.9%17.7%
Interquartile 75% (IQ3)53.8%28.4%
Interquartile Range (IQR)37.0%10.7%
Standard Deviation (Sample)31.2%11.1%
Standard Deviation (Population)30.7%11.0%

Similar Demographics by Female Poverty Among 18-24 Year Olds

Demographics Similar to Immigrants from Netherlands by Female Poverty Among 18-24 Year Olds

In terms of female poverty among 18-24 year olds, the demographic groups most similar to Immigrants from Netherlands are Immigrants from Malaysia (20.5%, a difference of 0.020%), English (20.5%, a difference of 0.020%), Hispanic or Latino (20.5%, a difference of 0.030%), Spaniard (20.5%, a difference of 0.050%), and Immigrants from Turkey (20.5%, a difference of 0.060%).
DemographicsRating | RankFemale Poverty Among 18-24 Year Olds
Zimbabweans
21.0
/100
|
#197
Fair
20.4%
Immigrants | Spain
20.7
/100
|
#198
Fair
20.4%
Germans
20.6
/100
|
#199
Fair
20.4%
Europeans
19.9
/100
|
#200
Poor
20.4%
Mexicans
18.3
/100
|
#201
Poor
20.5%
Immigrants | Turkey
17.7
/100
|
#202
Poor
20.5%
Immigrants | Malaysia
17.2
/100
|
#203
Poor
20.5%
Immigrants | Netherlands
17.0
/100
|
#204
Poor
20.5%
English
16.7
/100
|
#205
Poor
20.5%
Hispanics or Latinos
16.6
/100
|
#206
Poor
20.5%
Spaniards
16.3
/100
|
#207
Poor
20.5%
Dutch
15.9
/100
|
#208
Poor
20.5%
Arabs
15.5
/100
|
#209
Poor
20.5%
Immigrants | Ghana
14.3
/100
|
#210
Poor
20.5%
Immigrants | Western Europe
13.5
/100
|
#211
Poor
20.6%

Demographics Similar to Somalis by Female Poverty Among 18-24 Year Olds

In terms of female poverty among 18-24 year olds, the demographic groups most similar to Somalis are Arapaho (25.2%, a difference of 0.070%), German Russian (25.2%, a difference of 0.10%), Immigrants from Zaire (25.1%, a difference of 0.30%), Immigrants from Saudi Arabia (25.3%, a difference of 0.53%), and Yakama (25.3%, a difference of 0.78%).
DemographicsRating | RankFemale Poverty Among 18-24 Year Olds
Blacks/African Americans
0.0
/100
|
#315
Tragic
24.3%
Alsatians
0.0
/100
|
#316
Tragic
24.4%
Osage
0.0
/100
|
#317
Tragic
24.5%
Chickasaw
0.0
/100
|
#318
Tragic
24.5%
Dutch West Indians
0.0
/100
|
#319
Tragic
24.5%
Immigrants | Congo
0.0
/100
|
#320
Tragic
24.6%
Immigrants | Zaire
0.0
/100
|
#321
Tragic
25.1%
Somalis
0.0
/100
|
#322
Tragic
25.1%
Arapaho
0.0
/100
|
#323
Tragic
25.2%
German Russians
0.0
/100
|
#324
Tragic
25.2%
Immigrants | Saudi Arabia
0.0
/100
|
#325
Tragic
25.3%
Yakama
0.0
/100
|
#326
Tragic
25.3%
Ute
0.0
/100
|
#327
Tragic
25.4%
Natives/Alaskans
0.0
/100
|
#328
Tragic
25.4%
Cajuns
0.0
/100
|
#329
Tragic
25.7%