Immigrants from Netherlands vs Immigrants from China Female Poverty Among 18-24 Year Olds
COMPARE
Immigrants from Netherlands
Immigrants from China
Female Poverty Among 18-24 Year Olds
Female Poverty Among 18-24 Year Olds Comparison
Immigrants from Netherlands
Immigrants from China
20.5%
FEMALE POVERTY AMONG 18-24 YEAR OLDS
17.0/ 100
METRIC RATING
204th/ 347
METRIC RANK
20.2%
FEMALE POVERTY AMONG 18-24 YEAR OLDS
43.0/ 100
METRIC RATING
181st/ 347
METRIC RANK
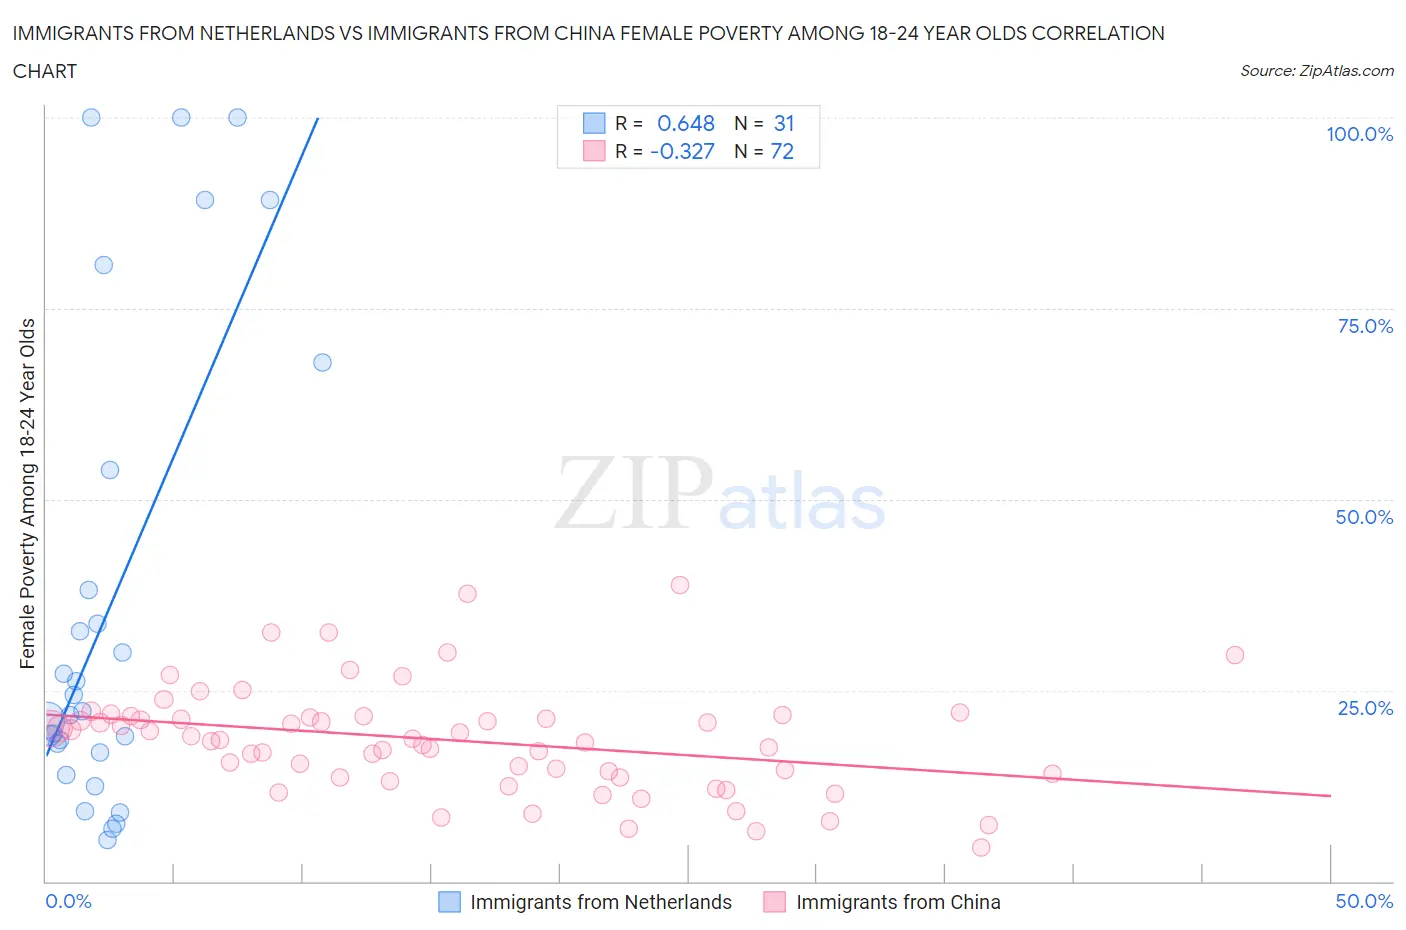
Immigrants from Netherlands vs Immigrants from China Female Poverty Among 18-24 Year Olds Correlation Chart
The statistical analysis conducted on geographies consisting of 233,588,287 people shows a significant positive correlation between the proportion of Immigrants from Netherlands and poverty level among females between the ages 18 and 24 in the United States with a correlation coefficient (R) of 0.648 and weighted average of 20.5%. Similarly, the statistical analysis conducted on geographies consisting of 442,287,819 people shows a mild negative correlation between the proportion of Immigrants from China and poverty level among females between the ages 18 and 24 in the United States with a correlation coefficient (R) of -0.327 and weighted average of 20.2%, a difference of 1.6%.
Female Poverty Among 18-24 Year Olds Correlation Summary
| Measurement | Immigrants from Netherlands | Immigrants from China |
| Minimum | 5.4% | 4.3% |
| Maximum | 100.0% | 38.8% |
| Range | 94.6% | 34.4% |
| Mean | 36.6% | 18.5% |
| Median | 22.3% | 18.6% |
| Interquartile 25% (IQ1) | 16.9% | 13.9% |
| Interquartile 75% (IQ3) | 53.8% | 21.5% |
| Interquartile Range (IQR) | 37.0% | 7.6% |
| Standard Deviation (Sample) | 31.2% | 6.9% |
| Standard Deviation (Population) | 30.7% | 6.9% |
Similar Demographics by Female Poverty Among 18-24 Year Olds
Demographics Similar to Immigrants from Netherlands by Female Poverty Among 18-24 Year Olds
In terms of female poverty among 18-24 year olds, the demographic groups most similar to Immigrants from Netherlands are Immigrants from Malaysia (20.5%, a difference of 0.020%), English (20.5%, a difference of 0.020%), Hispanic or Latino (20.5%, a difference of 0.030%), Spaniard (20.5%, a difference of 0.050%), and Immigrants from Turkey (20.5%, a difference of 0.060%).
| Demographics | Rating | Rank | Female Poverty Among 18-24 Year Olds |
| Zimbabweans | 21.0 /100 | #197 | Fair 20.4% |
| Immigrants | Spain | 20.7 /100 | #198 | Fair 20.4% |
| Germans | 20.6 /100 | #199 | Fair 20.4% |
| Europeans | 19.9 /100 | #200 | Poor 20.4% |
| Mexicans | 18.3 /100 | #201 | Poor 20.5% |
| Immigrants | Turkey | 17.7 /100 | #202 | Poor 20.5% |
| Immigrants | Malaysia | 17.2 /100 | #203 | Poor 20.5% |
| Immigrants | Netherlands | 17.0 /100 | #204 | Poor 20.5% |
| English | 16.7 /100 | #205 | Poor 20.5% |
| Hispanics or Latinos | 16.6 /100 | #206 | Poor 20.5% |
| Spaniards | 16.3 /100 | #207 | Poor 20.5% |
| Dutch | 15.9 /100 | #208 | Poor 20.5% |
| Arabs | 15.5 /100 | #209 | Poor 20.5% |
| Immigrants | Ghana | 14.3 /100 | #210 | Poor 20.5% |
| Immigrants | Western Europe | 13.5 /100 | #211 | Poor 20.6% |
Demographics Similar to Immigrants from China by Female Poverty Among 18-24 Year Olds
In terms of female poverty among 18-24 year olds, the demographic groups most similar to Immigrants from China are Immigrants from Barbados (20.2%, a difference of 0.010%), Iraqi (20.2%, a difference of 0.020%), Ethiopian (20.2%, a difference of 0.040%), Swiss (20.2%, a difference of 0.050%), and Immigrants from Kazakhstan (20.2%, a difference of 0.060%).
| Demographics | Rating | Rank | Female Poverty Among 18-24 Year Olds |
| Swedes | 50.0 /100 | #174 | Average 20.1% |
| South American Indians | 48.4 /100 | #175 | Average 20.1% |
| Kenyans | 44.9 /100 | #176 | Average 20.2% |
| Immigrants | Kazakhstan | 44.2 /100 | #177 | Average 20.2% |
| Swiss | 44.0 /100 | #178 | Average 20.2% |
| Ethiopians | 43.8 /100 | #179 | Average 20.2% |
| Iraqis | 43.3 /100 | #180 | Average 20.2% |
| Immigrants | China | 43.0 /100 | #181 | Average 20.2% |
| Immigrants | Barbados | 42.8 /100 | #182 | Average 20.2% |
| Lebanese | 40.6 /100 | #183 | Average 20.2% |
| Immigrants | Central America | 39.9 /100 | #184 | Fair 20.2% |
| Nepalese | 39.7 /100 | #185 | Fair 20.2% |
| Immigrants | Ethiopia | 37.3 /100 | #186 | Fair 20.2% |
| Immigrants | Mexico | 36.3 /100 | #187 | Fair 20.2% |
| Scandinavians | 34.6 /100 | #188 | Fair 20.3% |