Immigrants from Nepal vs Immigrants from Yemen Single Father Poverty
COMPARE
Immigrants from Nepal
Immigrants from Yemen
Single Father Poverty
Single Father Poverty Comparison
Immigrants from Nepal
Immigrants from Yemen
14.8%
SINGLE FATHER POVERTY
100.0/ 100
METRIC RATING
42nd/ 347
METRIC RANK
20.6%
SINGLE FATHER POVERTY
0.0/ 100
METRIC RATING
326th/ 347
METRIC RANK
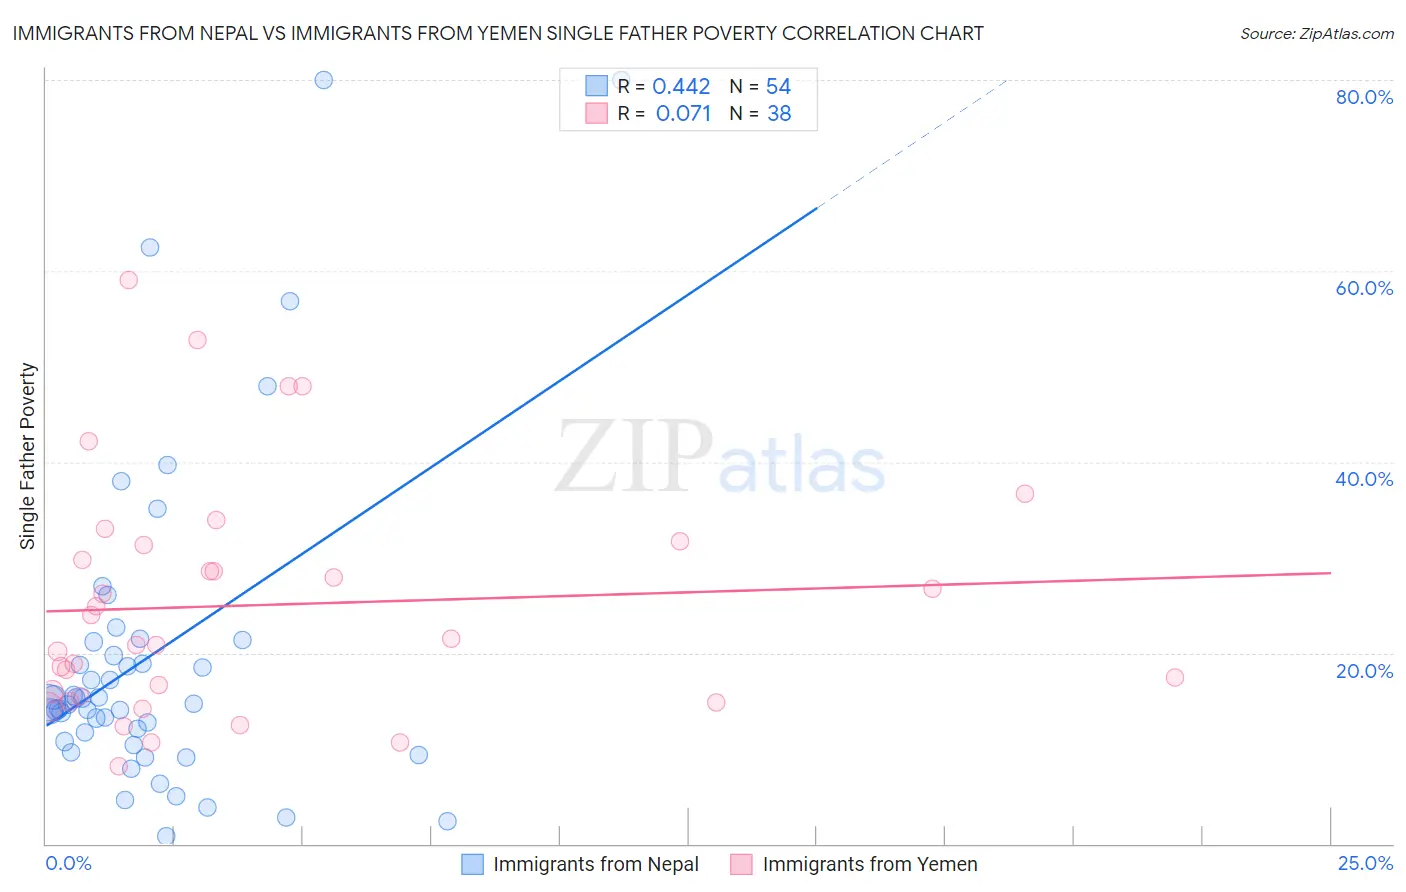
Immigrants from Nepal vs Immigrants from Yemen Single Father Poverty Correlation Chart
The statistical analysis conducted on geographies consisting of 159,641,053 people shows a moderate positive correlation between the proportion of Immigrants from Nepal and poverty level among single fathers in the United States with a correlation coefficient (R) of 0.442 and weighted average of 14.8%. Similarly, the statistical analysis conducted on geographies consisting of 76,647,654 people shows a slight positive correlation between the proportion of Immigrants from Yemen and poverty level among single fathers in the United States with a correlation coefficient (R) of 0.071 and weighted average of 20.6%, a difference of 39.2%.
Single Father Poverty Correlation Summary
| Measurement | Immigrants from Nepal | Immigrants from Yemen |
| Minimum | 0.76% | 8.1% |
| Maximum | 80.0% | 59.1% |
| Range | 79.2% | 51.0% |
| Mean | 19.8% | 25.0% |
| Median | 14.8% | 21.1% |
| Interquartile 25% (IQ1) | 10.7% | 15.5% |
| Interquartile 75% (IQ3) | 21.1% | 31.3% |
| Interquartile Range (IQR) | 10.5% | 15.9% |
| Standard Deviation (Sample) | 17.1% | 12.4% |
| Standard Deviation (Population) | 17.0% | 12.2% |
Similar Demographics by Single Father Poverty
Demographics Similar to Immigrants from Nepal by Single Father Poverty
In terms of single father poverty, the demographic groups most similar to Immigrants from Nepal are Indian (Asian) (14.8%, a difference of 0.0%), Immigrants from Eritrea (14.8%, a difference of 0.040%), Pima (14.8%, a difference of 0.17%), Immigrants from Asia (14.7%, a difference of 0.37%), and Bolivian (14.7%, a difference of 0.55%).
| Demographics | Rating | Rank | Single Father Poverty |
| Immigrants | Bolivia | 100.0 /100 | #35 | Exceptional 14.7% |
| Immigrants | Indonesia | 100.0 /100 | #36 | Exceptional 14.7% |
| Immigrants | Eastern Africa | 100.0 /100 | #37 | Exceptional 14.7% |
| Bolivians | 100.0 /100 | #38 | Exceptional 14.7% |
| Immigrants | Asia | 100.0 /100 | #39 | Exceptional 14.7% |
| Pima | 100.0 /100 | #40 | Exceptional 14.8% |
| Indians (Asian) | 100.0 /100 | #41 | Exceptional 14.8% |
| Immigrants | Nepal | 100.0 /100 | #42 | Exceptional 14.8% |
| Immigrants | Eritrea | 100.0 /100 | #43 | Exceptional 14.8% |
| Salvadorans | 100.0 /100 | #44 | Exceptional 14.9% |
| Immigrants | Somalia | 100.0 /100 | #45 | Exceptional 14.9% |
| Immigrants | Cambodia | 99.9 /100 | #46 | Exceptional 14.9% |
| Immigrants | China | 99.9 /100 | #47 | Exceptional 14.9% |
| Malaysians | 99.9 /100 | #48 | Exceptional 14.9% |
| Immigrants | Eastern Asia | 99.9 /100 | #49 | Exceptional 15.0% |
Demographics Similar to Immigrants from Yemen by Single Father Poverty
In terms of single father poverty, the demographic groups most similar to Immigrants from Yemen are Choctaw (20.7%, a difference of 0.69%), Black/African American (20.4%, a difference of 1.0%), American (20.1%, a difference of 2.6%), Pueblo (21.1%, a difference of 2.6%), and Pennsylvania German (20.0%, a difference of 2.8%).
| Demographics | Rating | Rank | Single Father Poverty |
| Slovaks | 0.0 /100 | #319 | Tragic 19.3% |
| Inupiat | 0.0 /100 | #320 | Tragic 19.5% |
| Cherokee | 0.0 /100 | #321 | Tragic 19.6% |
| Creek | 0.0 /100 | #322 | Tragic 19.8% |
| Pennsylvania Germans | 0.0 /100 | #323 | Tragic 20.0% |
| Americans | 0.0 /100 | #324 | Tragic 20.1% |
| Blacks/African Americans | 0.0 /100 | #325 | Tragic 20.4% |
| Immigrants | Yemen | 0.0 /100 | #326 | Tragic 20.6% |
| Choctaw | 0.0 /100 | #327 | Tragic 20.7% |
| Pueblo | 0.0 /100 | #328 | Tragic 21.1% |
| Colville | 0.0 /100 | #329 | Tragic 21.4% |
| Paiute | 0.0 /100 | #330 | Tragic 21.6% |
| Central American Indians | 0.0 /100 | #331 | Tragic 21.7% |
| Tohono O'odham | 0.0 /100 | #332 | Tragic 22.0% |
| Natives/Alaskans | 0.0 /100 | #333 | Tragic 22.4% |