Immigrants from Indonesia vs Immigrants from Taiwan Female Poverty Among 25-34 Year Olds
COMPARE
Immigrants from Indonesia
Immigrants from Taiwan
Female Poverty Among 25-34 Year Olds
Female Poverty Among 25-34 Year Olds Comparison
Immigrants from Indonesia
Immigrants from Taiwan
11.8%
FEMALE POVERTY AMONG 25-34 YEAR OLDS
99.8/ 100
METRIC RATING
41st/ 347
METRIC RANK
10.0%
FEMALE POVERTY AMONG 25-34 YEAR OLDS
100.0/ 100
METRIC RATING
2nd/ 347
METRIC RANK
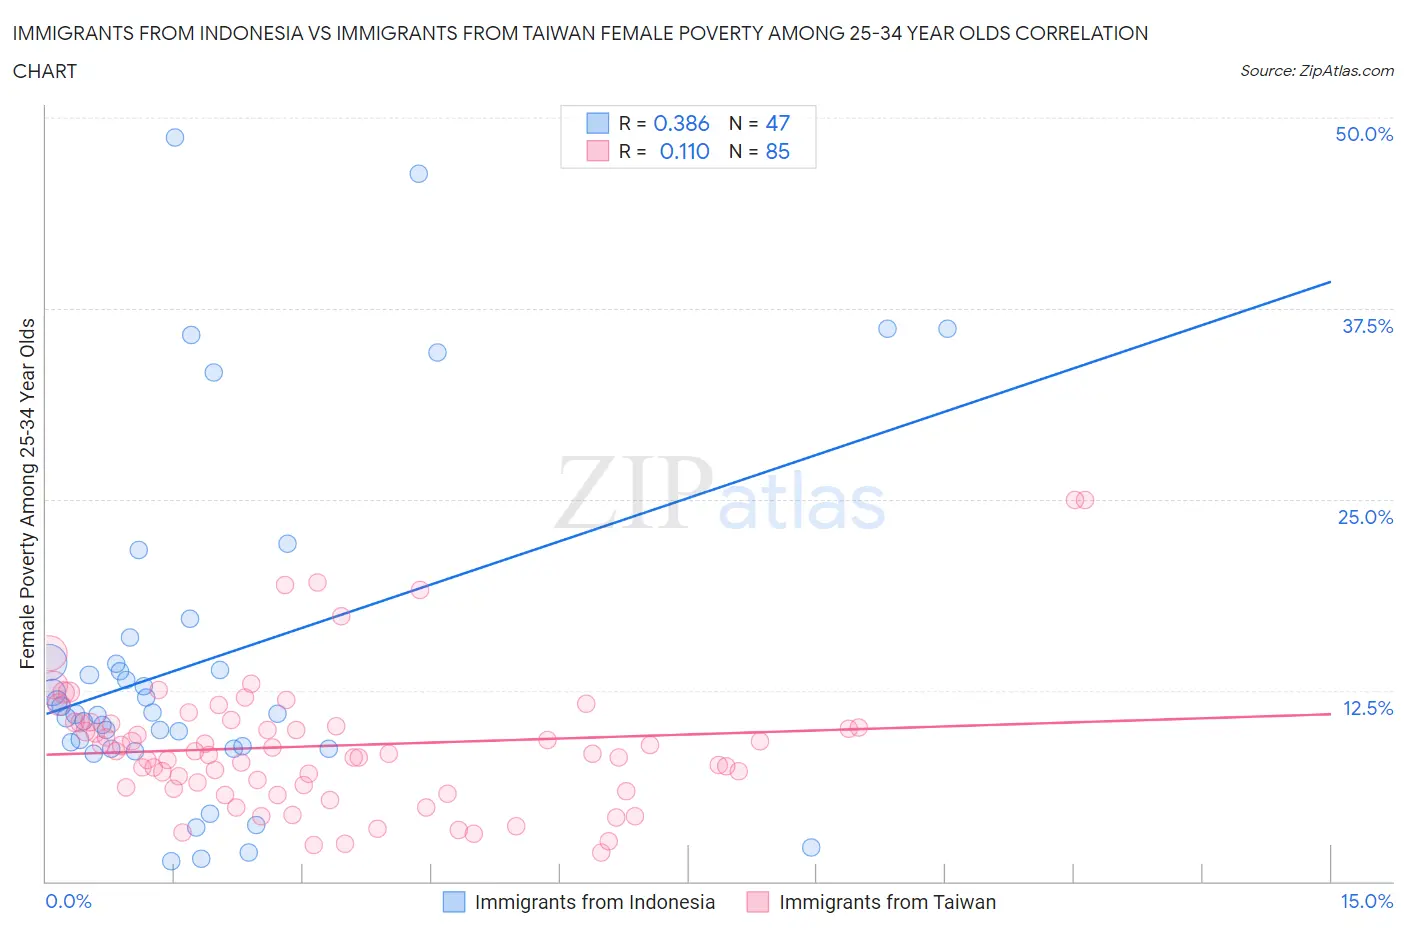
Immigrants from Indonesia vs Immigrants from Taiwan Female Poverty Among 25-34 Year Olds Correlation Chart
The statistical analysis conducted on geographies consisting of 214,279,540 people shows a mild positive correlation between the proportion of Immigrants from Indonesia and poverty level among females between the ages 25 and 34 in the United States with a correlation coefficient (R) of 0.386 and weighted average of 11.8%. Similarly, the statistical analysis conducted on geographies consisting of 293,956,409 people shows a poor positive correlation between the proportion of Immigrants from Taiwan and poverty level among females between the ages 25 and 34 in the United States with a correlation coefficient (R) of 0.110 and weighted average of 10.0%, a difference of 18.3%.
Female Poverty Among 25-34 Year Olds Correlation Summary
| Measurement | Immigrants from Indonesia | Immigrants from Taiwan |
| Minimum | 1.3% | 1.9% |
| Maximum | 48.7% | 25.0% |
| Range | 47.4% | 23.1% |
| Mean | 14.6% | 8.9% |
| Median | 11.0% | 8.4% |
| Interquartile 25% (IQ1) | 8.7% | 6.1% |
| Interquartile 75% (IQ3) | 14.3% | 10.4% |
| Interquartile Range (IQR) | 5.6% | 4.3% |
| Standard Deviation (Sample) | 11.3% | 4.4% |
| Standard Deviation (Population) | 11.2% | 4.4% |
Similar Demographics by Female Poverty Among 25-34 Year Olds
Demographics Similar to Immigrants from Indonesia by Female Poverty Among 25-34 Year Olds
In terms of female poverty among 25-34 year olds, the demographic groups most similar to Immigrants from Indonesia are Immigrants from Bulgaria (11.8%, a difference of 0.13%), Latvian (11.8%, a difference of 0.29%), Immigrants from Turkey (11.9%, a difference of 0.30%), Immigrants from North Macedonia (11.8%, a difference of 0.54%), and Egyptian (11.9%, a difference of 0.55%).
| Demographics | Rating | Rank | Female Poverty Among 25-34 Year Olds |
| Zimbabweans | 99.9 /100 | #34 | Exceptional 11.7% |
| Cambodians | 99.9 /100 | #35 | Exceptional 11.7% |
| Immigrants | Sri Lanka | 99.8 /100 | #36 | Exceptional 11.8% |
| Taiwanese | 99.8 /100 | #37 | Exceptional 11.8% |
| Immigrants | North Macedonia | 99.8 /100 | #38 | Exceptional 11.8% |
| Latvians | 99.8 /100 | #39 | Exceptional 11.8% |
| Immigrants | Bulgaria | 99.8 /100 | #40 | Exceptional 11.8% |
| Immigrants | Indonesia | 99.8 /100 | #41 | Exceptional 11.8% |
| Immigrants | Turkey | 99.7 /100 | #42 | Exceptional 11.9% |
| Egyptians | 99.7 /100 | #43 | Exceptional 11.9% |
| Immigrants | Australia | 99.7 /100 | #44 | Exceptional 11.9% |
| Macedonians | 99.7 /100 | #45 | Exceptional 11.9% |
| Immigrants | Serbia | 99.7 /100 | #46 | Exceptional 11.9% |
| Koreans | 99.6 /100 | #47 | Exceptional 12.0% |
| Immigrants | Belarus | 99.6 /100 | #48 | Exceptional 12.0% |
Demographics Similar to Immigrants from Taiwan by Female Poverty Among 25-34 Year Olds
In terms of female poverty among 25-34 year olds, the demographic groups most similar to Immigrants from Taiwan are Filipino (10.2%, a difference of 2.1%), Thai (10.2%, a difference of 2.2%), Immigrants from India (9.7%, a difference of 3.1%), Immigrants from Hong Kong (10.4%, a difference of 3.6%), and Immigrants from South Central Asia (10.8%, a difference of 7.4%).
| Demographics | Rating | Rank | Female Poverty Among 25-34 Year Olds |
| Immigrants | India | 100.0 /100 | #1 | Exceptional 9.7% |
| Immigrants | Taiwan | 100.0 /100 | #2 | Exceptional 10.0% |
| Filipinos | 100.0 /100 | #3 | Exceptional 10.2% |
| Thais | 100.0 /100 | #4 | Exceptional 10.2% |
| Immigrants | Hong Kong | 100.0 /100 | #5 | Exceptional 10.4% |
| Immigrants | South Central Asia | 100.0 /100 | #6 | Exceptional 10.8% |
| Chinese | 100.0 /100 | #7 | Exceptional 11.0% |
| Immigrants | Iran | 100.0 /100 | #8 | Exceptional 11.0% |
| Immigrants | Singapore | 100.0 /100 | #9 | Exceptional 11.1% |
| Immigrants | Lithuania | 100.0 /100 | #10 | Exceptional 11.1% |
| Immigrants | Korea | 100.0 /100 | #11 | Exceptional 11.1% |
| Immigrants | Ireland | 100.0 /100 | #12 | Exceptional 11.2% |
| Burmese | 100.0 /100 | #13 | Exceptional 11.2% |
| Indians (Asian) | 100.0 /100 | #14 | Exceptional 11.2% |
| Assyrians/Chaldeans/Syriacs | 100.0 /100 | #15 | Exceptional 11.2% |