Immigrants from Moldova vs British Female Poverty Among 18-24 Year Olds
COMPARE
Immigrants from Moldova
British
Female Poverty Among 18-24 Year Olds
Female Poverty Among 18-24 Year Olds Comparison
Immigrants from Moldova
British
17.9%
FEMALE POVERTY AMONG 18-24 YEAR OLDS
100.0/ 100
METRIC RATING
32nd/ 347
METRIC RANK
20.7%
FEMALE POVERTY AMONG 18-24 YEAR OLDS
9.4/ 100
METRIC RATING
220th/ 347
METRIC RANK
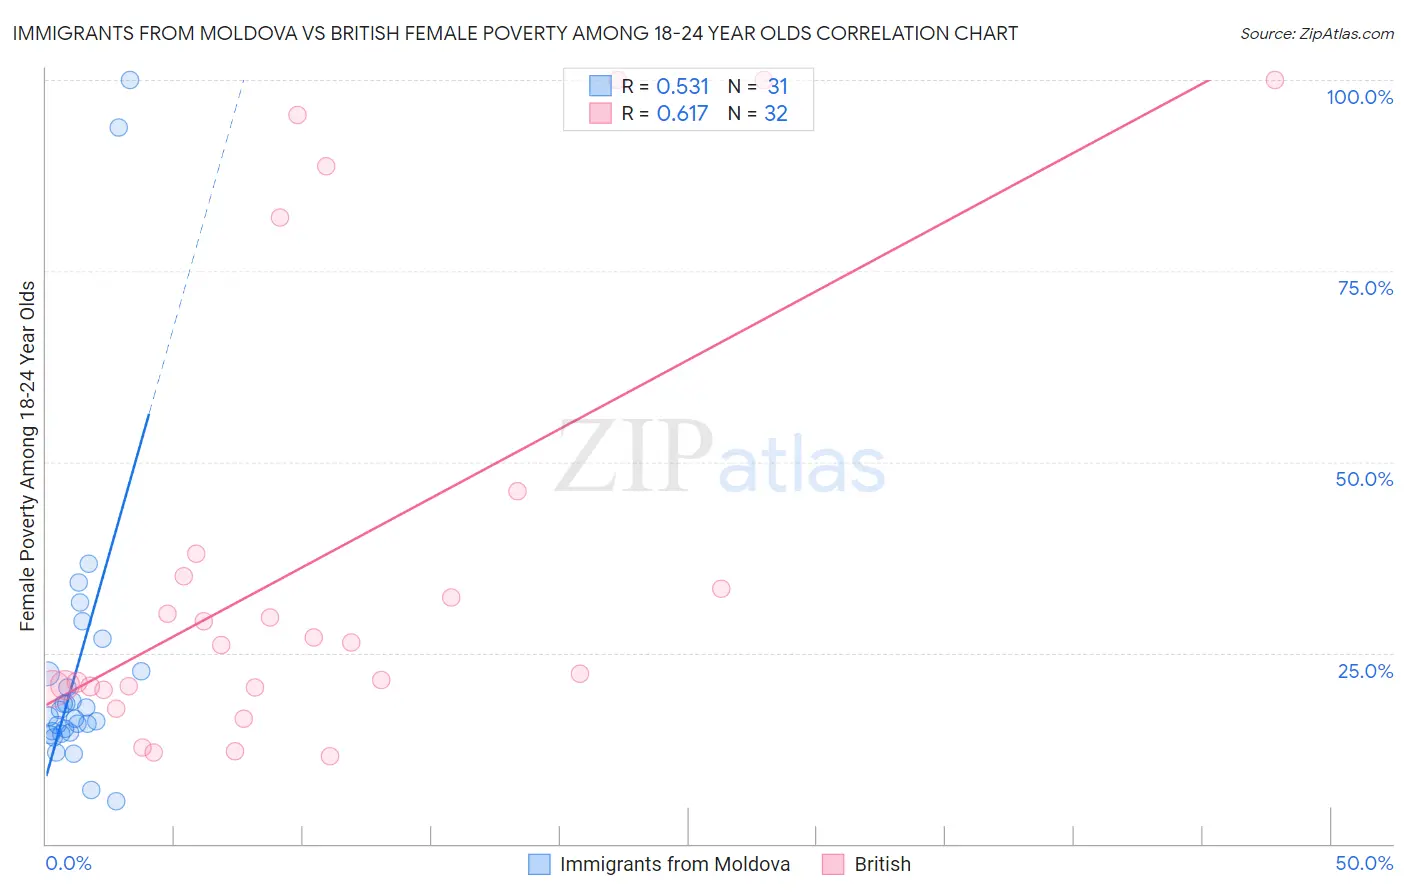
Immigrants from Moldova vs British Female Poverty Among 18-24 Year Olds Correlation Chart
The statistical analysis conducted on geographies consisting of 123,051,261 people shows a substantial positive correlation between the proportion of Immigrants from Moldova and poverty level among females between the ages 18 and 24 in the United States with a correlation coefficient (R) of 0.531 and weighted average of 17.9%. Similarly, the statistical analysis conducted on geographies consisting of 506,236,186 people shows a significant positive correlation between the proportion of British and poverty level among females between the ages 18 and 24 in the United States with a correlation coefficient (R) of 0.617 and weighted average of 20.7%, a difference of 15.7%.
Female Poverty Among 18-24 Year Olds Correlation Summary
| Measurement | Immigrants from Moldova | British |
| Minimum | 5.6% | 11.5% |
| Maximum | 100.0% | 100.0% |
| Range | 94.4% | 88.5% |
| Mean | 23.5% | 37.2% |
| Median | 16.7% | 26.2% |
| Interquartile 25% (IQ1) | 14.5% | 20.4% |
| Interquartile 75% (IQ3) | 22.6% | 36.5% |
| Interquartile Range (IQR) | 8.1% | 16.1% |
| Standard Deviation (Sample) | 20.8% | 29.1% |
| Standard Deviation (Population) | 20.5% | 28.7% |
Similar Demographics by Female Poverty Among 18-24 Year Olds
Demographics Similar to Immigrants from Moldova by Female Poverty Among 18-24 Year Olds
In terms of female poverty among 18-24 year olds, the demographic groups most similar to Immigrants from Moldova are Native Hawaiian (17.9%, a difference of 0.030%), Immigrants from Nicaragua (17.9%, a difference of 0.14%), Immigrants from Greece (17.9%, a difference of 0.18%), Immigrants from South America (17.9%, a difference of 0.23%), and Immigrants from Vietnam (17.8%, a difference of 0.25%).
| Demographics | Rating | Rank | Female Poverty Among 18-24 Year Olds |
| Immigrants | South Central Asia | 100.0 /100 | #25 | Exceptional 17.6% |
| Immigrants | Fiji | 100.0 /100 | #26 | Exceptional 17.7% |
| Colombians | 100.0 /100 | #27 | Exceptional 17.7% |
| Venezuelans | 100.0 /100 | #28 | Exceptional 17.7% |
| Portuguese | 100.0 /100 | #29 | Exceptional 17.8% |
| Immigrants | South Eastern Asia | 100.0 /100 | #30 | Exceptional 17.8% |
| Immigrants | Vietnam | 100.0 /100 | #31 | Exceptional 17.8% |
| Immigrants | Moldova | 100.0 /100 | #32 | Exceptional 17.9% |
| Native Hawaiians | 100.0 /100 | #33 | Exceptional 17.9% |
| Immigrants | Nicaragua | 100.0 /100 | #34 | Exceptional 17.9% |
| Immigrants | Greece | 100.0 /100 | #35 | Exceptional 17.9% |
| Immigrants | South America | 100.0 /100 | #36 | Exceptional 17.9% |
| Immigrants | Croatia | 100.0 /100 | #37 | Exceptional 17.9% |
| South Americans | 100.0 /100 | #38 | Exceptional 18.0% |
| Puget Sound Salish | 100.0 /100 | #39 | Exceptional 18.0% |
Demographics Similar to British by Female Poverty Among 18-24 Year Olds
In terms of female poverty among 18-24 year olds, the demographic groups most similar to British are Immigrants from Micronesia (20.7%, a difference of 0.020%), Immigrants from Nepal (20.7%, a difference of 0.030%), Immigrants from Laos (20.6%, a difference of 0.040%), Barbadian (20.7%, a difference of 0.070%), and Immigrants from Western Africa (20.6%, a difference of 0.11%).
| Demographics | Rating | Rank | Female Poverty Among 18-24 Year Olds |
| Northern Europeans | 11.6 /100 | #213 | Poor 20.6% |
| Immigrants | South Africa | 10.7 /100 | #214 | Poor 20.6% |
| Spanish | 10.4 /100 | #215 | Poor 20.6% |
| Immigrants | Western Africa | 10.2 /100 | #216 | Poor 20.6% |
| Immigrants | Laos | 9.7 /100 | #217 | Tragic 20.6% |
| Immigrants | Nepal | 9.6 /100 | #218 | Tragic 20.7% |
| Immigrants | Micronesia | 9.6 /100 | #219 | Tragic 20.7% |
| British | 9.4 /100 | #220 | Tragic 20.7% |
| Barbadians | 9.0 /100 | #221 | Tragic 20.7% |
| Guatemalans | 8.1 /100 | #222 | Tragic 20.7% |
| French | 7.9 /100 | #223 | Tragic 20.7% |
| Immigrants | Liberia | 7.6 /100 | #224 | Tragic 20.7% |
| Norwegians | 7.3 /100 | #225 | Tragic 20.7% |
| Estonians | 7.2 /100 | #226 | Tragic 20.7% |
| Immigrants | Sweden | 6.8 /100 | #227 | Tragic 20.7% |