Immigrants from the Azores vs British Female Poverty Among 18-24 Year Olds
COMPARE
Immigrants from the Azores
British
Female Poverty Among 18-24 Year Olds
Female Poverty Among 18-24 Year Olds Comparison
Immigrants from the Azores
British
16.7%
FEMALE POVERTY AMONG 18-24 YEAR OLDS
100.0/ 100
METRIC RATING
7th/ 347
METRIC RANK
20.7%
FEMALE POVERTY AMONG 18-24 YEAR OLDS
9.4/ 100
METRIC RATING
220th/ 347
METRIC RANK
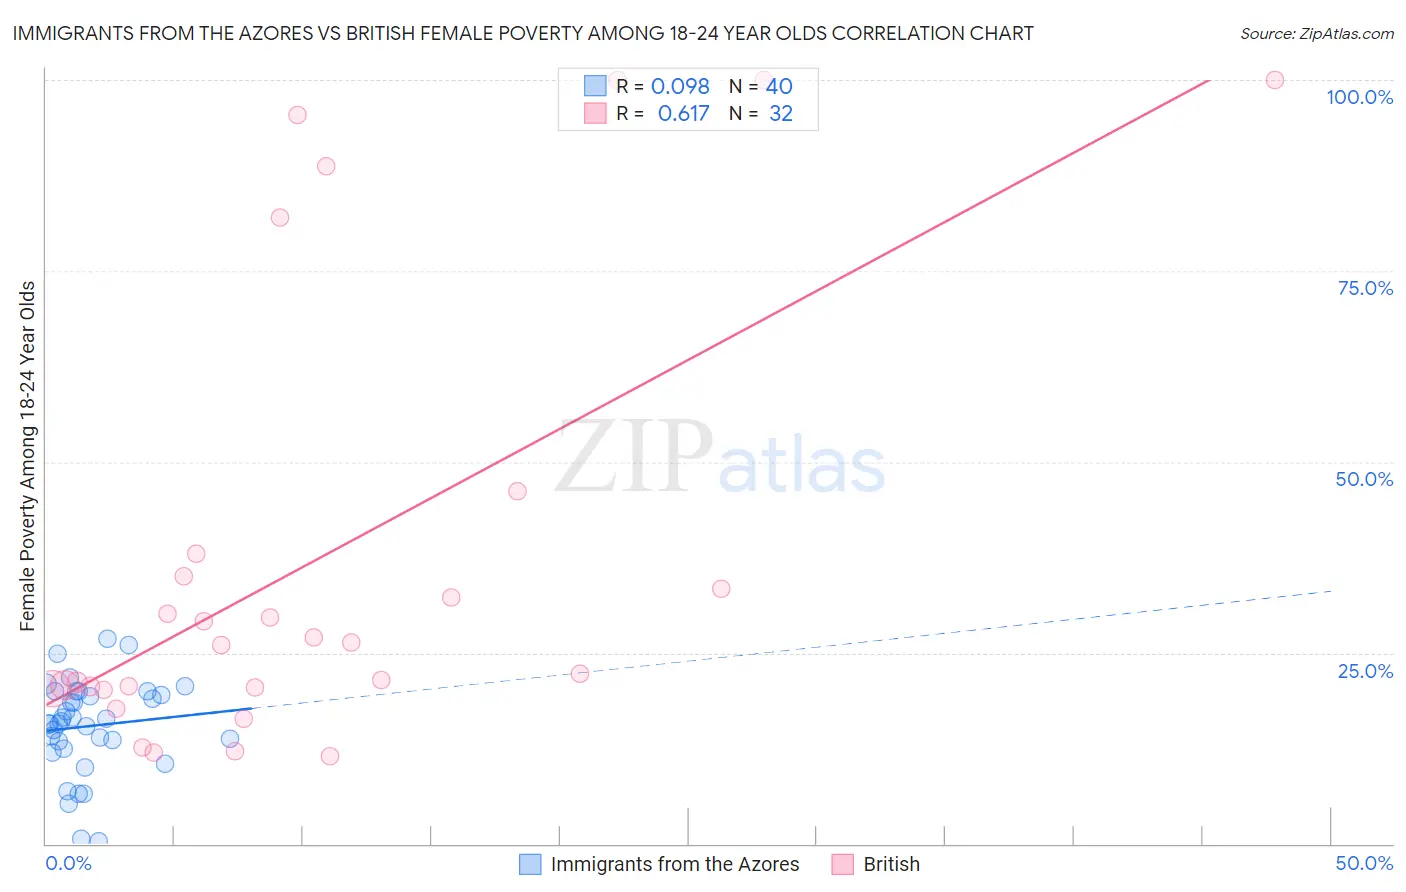
Immigrants from the Azores vs British Female Poverty Among 18-24 Year Olds Correlation Chart
The statistical analysis conducted on geographies consisting of 45,673,752 people shows a slight positive correlation between the proportion of Immigrants from the Azores and poverty level among females between the ages 18 and 24 in the United States with a correlation coefficient (R) of 0.098 and weighted average of 16.7%. Similarly, the statistical analysis conducted on geographies consisting of 506,236,186 people shows a significant positive correlation between the proportion of British and poverty level among females between the ages 18 and 24 in the United States with a correlation coefficient (R) of 0.617 and weighted average of 20.7%, a difference of 23.8%.
Female Poverty Among 18-24 Year Olds Correlation Summary
| Measurement | Immigrants from the Azores | British |
| Minimum | 0.25% | 11.5% |
| Maximum | 26.8% | 100.0% |
| Range | 26.6% | 88.5% |
| Mean | 15.4% | 37.2% |
| Median | 15.9% | 26.2% |
| Interquartile 25% (IQ1) | 12.9% | 20.4% |
| Interquartile 75% (IQ3) | 19.7% | 36.5% |
| Interquartile Range (IQR) | 6.8% | 16.1% |
| Standard Deviation (Sample) | 6.1% | 29.1% |
| Standard Deviation (Population) | 6.0% | 28.7% |
Similar Demographics by Female Poverty Among 18-24 Year Olds
Demographics Similar to Immigrants from the Azores by Female Poverty Among 18-24 Year Olds
In terms of female poverty among 18-24 year olds, the demographic groups most similar to Immigrants from the Azores are Immigrants from Philippines (16.7%, a difference of 0.060%), Immigrants from Bolivia (16.7%, a difference of 0.29%), Immigrants from Portugal (16.5%, a difference of 0.80%), Immigrants from Peru (16.9%, a difference of 1.1%), and Korean (16.9%, a difference of 1.5%).
| Demographics | Rating | Rank | Female Poverty Among 18-24 Year Olds |
| Assyrians/Chaldeans/Syriacs | 100.0 /100 | #1 | Exceptional 13.7% |
| Chinese | 100.0 /100 | #2 | Exceptional 16.2% |
| Immigrants | Cuba | 100.0 /100 | #3 | Exceptional 16.4% |
| Immigrants | India | 100.0 /100 | #4 | Exceptional 16.4% |
| Immigrants | Portugal | 100.0 /100 | #5 | Exceptional 16.5% |
| Immigrants | Philippines | 100.0 /100 | #6 | Exceptional 16.7% |
| Immigrants | Azores | 100.0 /100 | #7 | Exceptional 16.7% |
| Immigrants | Bolivia | 100.0 /100 | #8 | Exceptional 16.7% |
| Immigrants | Peru | 100.0 /100 | #9 | Exceptional 16.9% |
| Koreans | 100.0 /100 | #10 | Exceptional 16.9% |
| Thais | 100.0 /100 | #11 | Exceptional 17.0% |
| Immigrants | Pakistan | 100.0 /100 | #12 | Exceptional 17.0% |
| Immigrants | Poland | 100.0 /100 | #13 | Exceptional 17.1% |
| Tongans | 100.0 /100 | #14 | Exceptional 17.1% |
| Cubans | 100.0 /100 | #15 | Exceptional 17.2% |
Demographics Similar to British by Female Poverty Among 18-24 Year Olds
In terms of female poverty among 18-24 year olds, the demographic groups most similar to British are Immigrants from Micronesia (20.7%, a difference of 0.020%), Immigrants from Nepal (20.7%, a difference of 0.030%), Immigrants from Laos (20.6%, a difference of 0.040%), Barbadian (20.7%, a difference of 0.070%), and Immigrants from Western Africa (20.6%, a difference of 0.11%).
| Demographics | Rating | Rank | Female Poverty Among 18-24 Year Olds |
| Northern Europeans | 11.6 /100 | #213 | Poor 20.6% |
| Immigrants | South Africa | 10.7 /100 | #214 | Poor 20.6% |
| Spanish | 10.4 /100 | #215 | Poor 20.6% |
| Immigrants | Western Africa | 10.2 /100 | #216 | Poor 20.6% |
| Immigrants | Laos | 9.7 /100 | #217 | Tragic 20.6% |
| Immigrants | Nepal | 9.6 /100 | #218 | Tragic 20.7% |
| Immigrants | Micronesia | 9.6 /100 | #219 | Tragic 20.7% |
| British | 9.4 /100 | #220 | Tragic 20.7% |
| Barbadians | 9.0 /100 | #221 | Tragic 20.7% |
| Guatemalans | 8.1 /100 | #222 | Tragic 20.7% |
| French | 7.9 /100 | #223 | Tragic 20.7% |
| Immigrants | Liberia | 7.6 /100 | #224 | Tragic 20.7% |
| Norwegians | 7.3 /100 | #225 | Tragic 20.7% |
| Estonians | 7.2 /100 | #226 | Tragic 20.7% |
| Immigrants | Sweden | 6.8 /100 | #227 | Tragic 20.7% |