Immigrants from Moldova vs Indonesian Female Poverty Among 18-24 Year Olds
COMPARE
Immigrants from Moldova
Indonesian
Female Poverty Among 18-24 Year Olds
Female Poverty Among 18-24 Year Olds Comparison
Immigrants from Moldova
Indonesians
17.9%
FEMALE POVERTY AMONG 18-24 YEAR OLDS
100.0/ 100
METRIC RATING
32nd/ 347
METRIC RANK
22.5%
FEMALE POVERTY AMONG 18-24 YEAR OLDS
0.0/ 100
METRIC RATING
294th/ 347
METRIC RANK
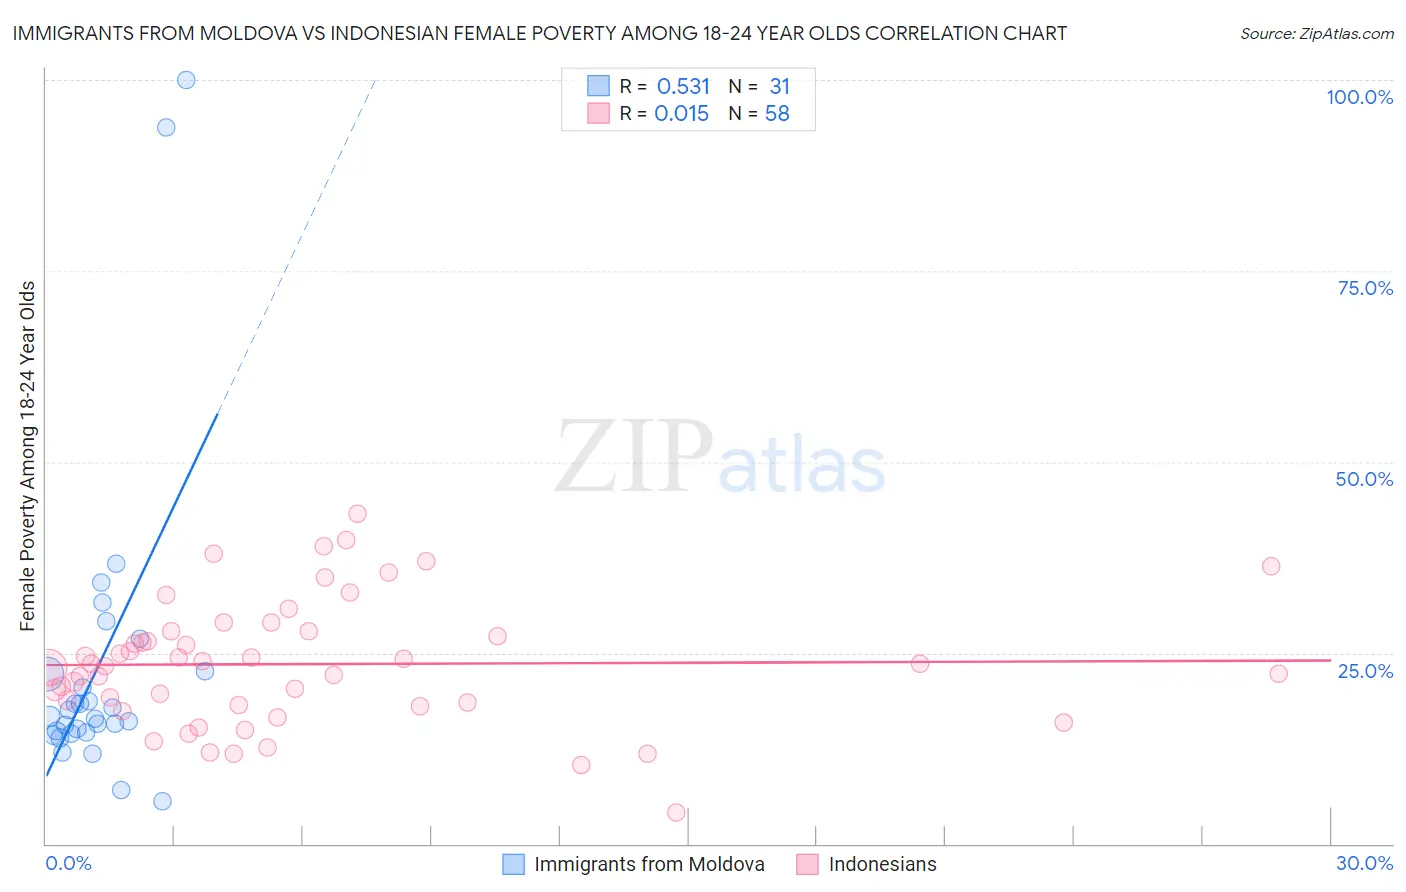
Immigrants from Moldova vs Indonesian Female Poverty Among 18-24 Year Olds Correlation Chart
The statistical analysis conducted on geographies consisting of 123,051,261 people shows a substantial positive correlation between the proportion of Immigrants from Moldova and poverty level among females between the ages 18 and 24 in the United States with a correlation coefficient (R) of 0.531 and weighted average of 17.9%. Similarly, the statistical analysis conducted on geographies consisting of 161,434,241 people shows no correlation between the proportion of Indonesians and poverty level among females between the ages 18 and 24 in the United States with a correlation coefficient (R) of 0.015 and weighted average of 22.5%, a difference of 25.9%.
Female Poverty Among 18-24 Year Olds Correlation Summary
| Measurement | Immigrants from Moldova | Indonesian |
| Minimum | 5.6% | 4.1% |
| Maximum | 100.0% | 43.2% |
| Range | 94.4% | 39.1% |
| Mean | 23.5% | 23.5% |
| Median | 16.7% | 23.4% |
| Interquartile 25% (IQ1) | 14.5% | 18.2% |
| Interquartile 75% (IQ3) | 22.6% | 27.8% |
| Interquartile Range (IQR) | 8.1% | 9.6% |
| Standard Deviation (Sample) | 20.8% | 8.2% |
| Standard Deviation (Population) | 20.5% | 8.1% |
Similar Demographics by Female Poverty Among 18-24 Year Olds
Demographics Similar to Immigrants from Moldova by Female Poverty Among 18-24 Year Olds
In terms of female poverty among 18-24 year olds, the demographic groups most similar to Immigrants from Moldova are Native Hawaiian (17.9%, a difference of 0.030%), Immigrants from Nicaragua (17.9%, a difference of 0.14%), Immigrants from Greece (17.9%, a difference of 0.18%), Immigrants from South America (17.9%, a difference of 0.23%), and Immigrants from Vietnam (17.8%, a difference of 0.25%).
| Demographics | Rating | Rank | Female Poverty Among 18-24 Year Olds |
| Immigrants | South Central Asia | 100.0 /100 | #25 | Exceptional 17.6% |
| Immigrants | Fiji | 100.0 /100 | #26 | Exceptional 17.7% |
| Colombians | 100.0 /100 | #27 | Exceptional 17.7% |
| Venezuelans | 100.0 /100 | #28 | Exceptional 17.7% |
| Portuguese | 100.0 /100 | #29 | Exceptional 17.8% |
| Immigrants | South Eastern Asia | 100.0 /100 | #30 | Exceptional 17.8% |
| Immigrants | Vietnam | 100.0 /100 | #31 | Exceptional 17.8% |
| Immigrants | Moldova | 100.0 /100 | #32 | Exceptional 17.9% |
| Native Hawaiians | 100.0 /100 | #33 | Exceptional 17.9% |
| Immigrants | Nicaragua | 100.0 /100 | #34 | Exceptional 17.9% |
| Immigrants | Greece | 100.0 /100 | #35 | Exceptional 17.9% |
| Immigrants | South America | 100.0 /100 | #36 | Exceptional 17.9% |
| Immigrants | Croatia | 100.0 /100 | #37 | Exceptional 17.9% |
| South Americans | 100.0 /100 | #38 | Exceptional 18.0% |
| Puget Sound Salish | 100.0 /100 | #39 | Exceptional 18.0% |
Demographics Similar to Indonesians by Female Poverty Among 18-24 Year Olds
In terms of female poverty among 18-24 year olds, the demographic groups most similar to Indonesians are U.S. Virgin Islander (22.5%, a difference of 0.030%), Alaskan Athabascan (22.5%, a difference of 0.070%), Bangladeshi (22.5%, a difference of 0.12%), Shoshone (22.5%, a difference of 0.12%), and Menominee (22.5%, a difference of 0.23%).
| Demographics | Rating | Rank | Female Poverty Among 18-24 Year Olds |
| Immigrants | Middle Africa | 0.0 /100 | #287 | Tragic 22.1% |
| Dominicans | 0.0 /100 | #288 | Tragic 22.3% |
| French American Indians | 0.0 /100 | #289 | Tragic 22.3% |
| Immigrants | Senegal | 0.0 /100 | #290 | Tragic 22.4% |
| Bangladeshis | 0.0 /100 | #291 | Tragic 22.5% |
| Alaskan Athabascans | 0.0 /100 | #292 | Tragic 22.5% |
| U.S. Virgin Islanders | 0.0 /100 | #293 | Tragic 22.5% |
| Indonesians | 0.0 /100 | #294 | Tragic 22.5% |
| Shoshone | 0.0 /100 | #295 | Tragic 22.5% |
| Menominee | 0.0 /100 | #296 | Tragic 22.5% |
| Inupiat | 0.0 /100 | #297 | Tragic 22.6% |
| Central American Indians | 0.0 /100 | #298 | Tragic 22.6% |
| Cherokee | 0.0 /100 | #299 | Tragic 22.7% |
| Africans | 0.0 /100 | #300 | Tragic 22.8% |
| Seminole | 0.0 /100 | #301 | Tragic 22.9% |