Immigrants from Middle Africa vs Hmong Female Poverty Among 18-24 Year Olds
COMPARE
Immigrants from Middle Africa
Hmong
Female Poverty Among 18-24 Year Olds
Female Poverty Among 18-24 Year Olds Comparison
Immigrants from Middle Africa
Hmong
22.1%
FEMALE POVERTY AMONG 18-24 YEAR OLDS
0.0/ 100
METRIC RATING
287th/ 347
METRIC RANK
20.0%
FEMALE POVERTY AMONG 18-24 YEAR OLDS
55.4/ 100
METRIC RATING
169th/ 347
METRIC RANK
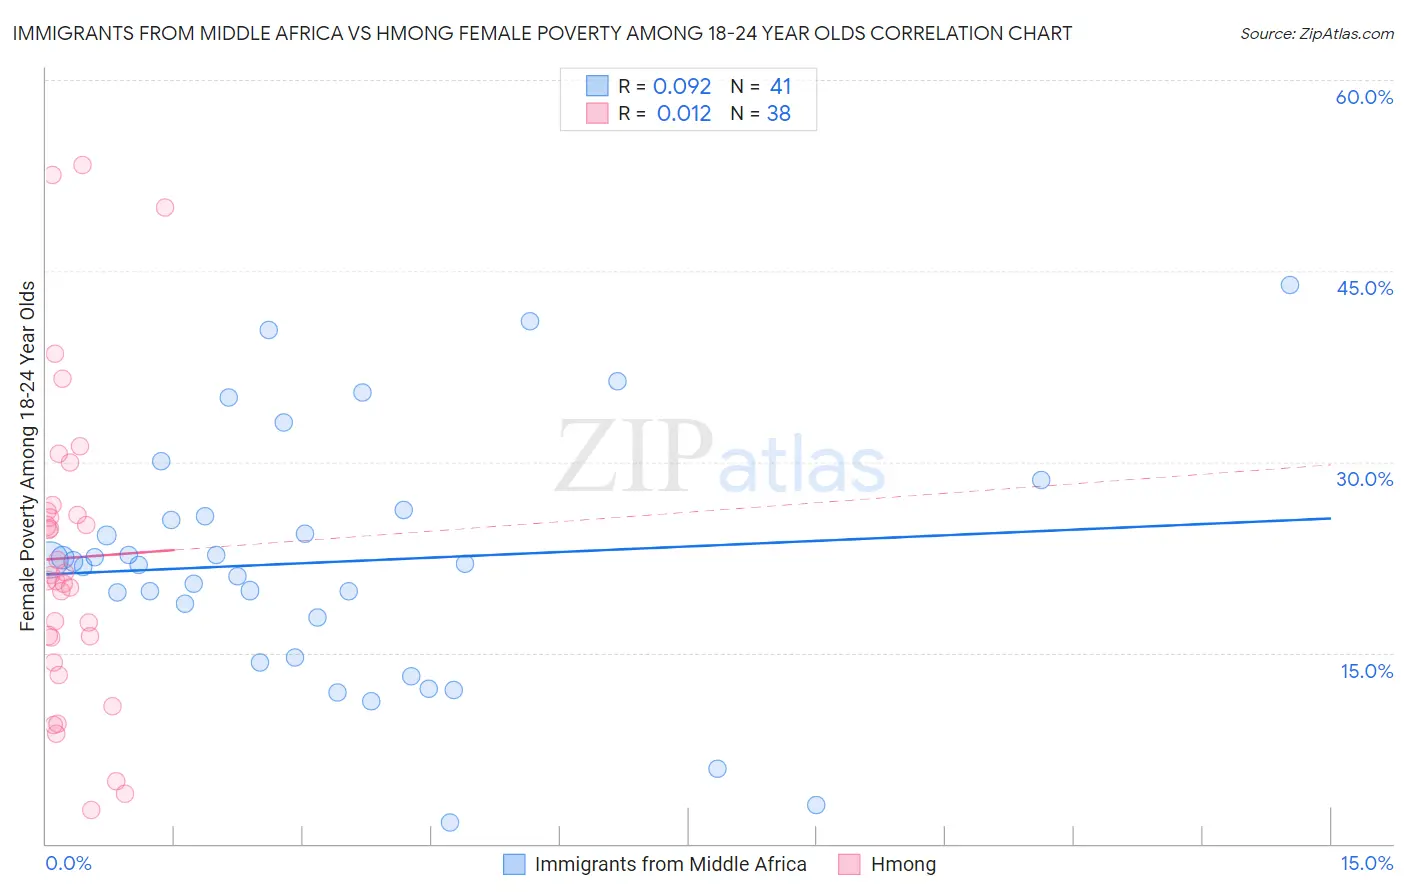
Immigrants from Middle Africa vs Hmong Female Poverty Among 18-24 Year Olds Correlation Chart
The statistical analysis conducted on geographies consisting of 200,899,042 people shows a slight positive correlation between the proportion of Immigrants from Middle Africa and poverty level among females between the ages 18 and 24 in the United States with a correlation coefficient (R) of 0.092 and weighted average of 22.1%. Similarly, the statistical analysis conducted on geographies consisting of 24,664,746 people shows no correlation between the proportion of Hmong and poverty level among females between the ages 18 and 24 in the United States with a correlation coefficient (R) of 0.012 and weighted average of 20.0%, a difference of 10.2%.
Female Poverty Among 18-24 Year Olds Correlation Summary
| Measurement | Immigrants from Middle Africa | Hmong |
| Minimum | 1.6% | 2.6% |
| Maximum | 43.9% | 53.3% |
| Range | 42.3% | 50.7% |
| Mean | 22.1% | 22.5% |
| Median | 22.0% | 20.9% |
| Interquartile 25% (IQ1) | 16.2% | 16.2% |
| Interquartile 75% (IQ3) | 26.0% | 26.1% |
| Interquartile Range (IQR) | 9.8% | 9.9% |
| Standard Deviation (Sample) | 9.6% | 12.1% |
| Standard Deviation (Population) | 9.5% | 11.9% |
Similar Demographics by Female Poverty Among 18-24 Year Olds
Demographics Similar to Immigrants from Middle Africa by Female Poverty Among 18-24 Year Olds
In terms of female poverty among 18-24 year olds, the demographic groups most similar to Immigrants from Middle Africa are Ugandan (22.1%, a difference of 0.010%), Ottawa (22.0%, a difference of 0.20%), Tlingit-Haida (22.0%, a difference of 0.32%), Subsaharan African (22.0%, a difference of 0.33%), and Bermudan (21.9%, a difference of 0.63%).
| Demographics | Rating | Rank | Female Poverty Among 18-24 Year Olds |
| Immigrants | Dominica | 0.1 /100 | #280 | Tragic 21.9% |
| Immigrants | Dominican Republic | 0.1 /100 | #281 | Tragic 21.9% |
| Bermudans | 0.1 /100 | #282 | Tragic 21.9% |
| Sub-Saharan Africans | 0.0 /100 | #283 | Tragic 22.0% |
| Tlingit-Haida | 0.0 /100 | #284 | Tragic 22.0% |
| Ottawa | 0.0 /100 | #285 | Tragic 22.0% |
| Ugandans | 0.0 /100 | #286 | Tragic 22.1% |
| Immigrants | Middle Africa | 0.0 /100 | #287 | Tragic 22.1% |
| Dominicans | 0.0 /100 | #288 | Tragic 22.3% |
| French American Indians | 0.0 /100 | #289 | Tragic 22.3% |
| Immigrants | Senegal | 0.0 /100 | #290 | Tragic 22.4% |
| Bangladeshis | 0.0 /100 | #291 | Tragic 22.5% |
| Alaskan Athabascans | 0.0 /100 | #292 | Tragic 22.5% |
| U.S. Virgin Islanders | 0.0 /100 | #293 | Tragic 22.5% |
| Indonesians | 0.0 /100 | #294 | Tragic 22.5% |
Demographics Similar to Hmong by Female Poverty Among 18-24 Year Olds
In terms of female poverty among 18-24 year olds, the demographic groups most similar to Hmong are Iranian (20.1%, a difference of 0.040%), Immigrants from Nigeria (20.1%, a difference of 0.060%), Belizean (20.1%, a difference of 0.17%), Fijian (20.0%, a difference of 0.19%), and Irish (20.1%, a difference of 0.27%).
| Demographics | Rating | Rank | Female Poverty Among 18-24 Year Olds |
| French Canadians | 73.0 /100 | #162 | Good 19.9% |
| Malaysians | 72.7 /100 | #163 | Good 19.9% |
| Central Americans | 70.0 /100 | #164 | Good 19.9% |
| Eastern Europeans | 69.3 /100 | #165 | Good 19.9% |
| Belgians | 69.1 /100 | #166 | Good 19.9% |
| Czechoslovakians | 61.8 /100 | #167 | Good 20.0% |
| Fijians | 59.1 /100 | #168 | Average 20.0% |
| Hmong | 55.4 /100 | #169 | Average 20.0% |
| Iranians | 54.7 /100 | #170 | Average 20.1% |
| Immigrants | Nigeria | 54.3 /100 | #171 | Average 20.1% |
| Belizeans | 52.0 /100 | #172 | Average 20.1% |
| Irish | 50.0 /100 | #173 | Average 20.1% |
| Swedes | 50.0 /100 | #174 | Average 20.1% |
| South American Indians | 48.4 /100 | #175 | Average 20.1% |
| Kenyans | 44.9 /100 | #176 | Average 20.2% |