Immigrants from Micronesia vs Northern European Seniors Poverty Over the Age of 75
COMPARE
Immigrants from Micronesia
Northern European
Seniors Poverty Over the Age of 75
Seniors Poverty Over the Age of 75 Comparison
Immigrants from Micronesia
Northern Europeans
11.4%
SENIORS POVERTY OVER THE AGE OF 75
96.0/ 100
METRIC RATING
73rd/ 347
METRIC RANK
10.7%
SENIORS POVERTY OVER THE AGE OF 75
99.8/ 100
METRIC RATING
27th/ 347
METRIC RANK
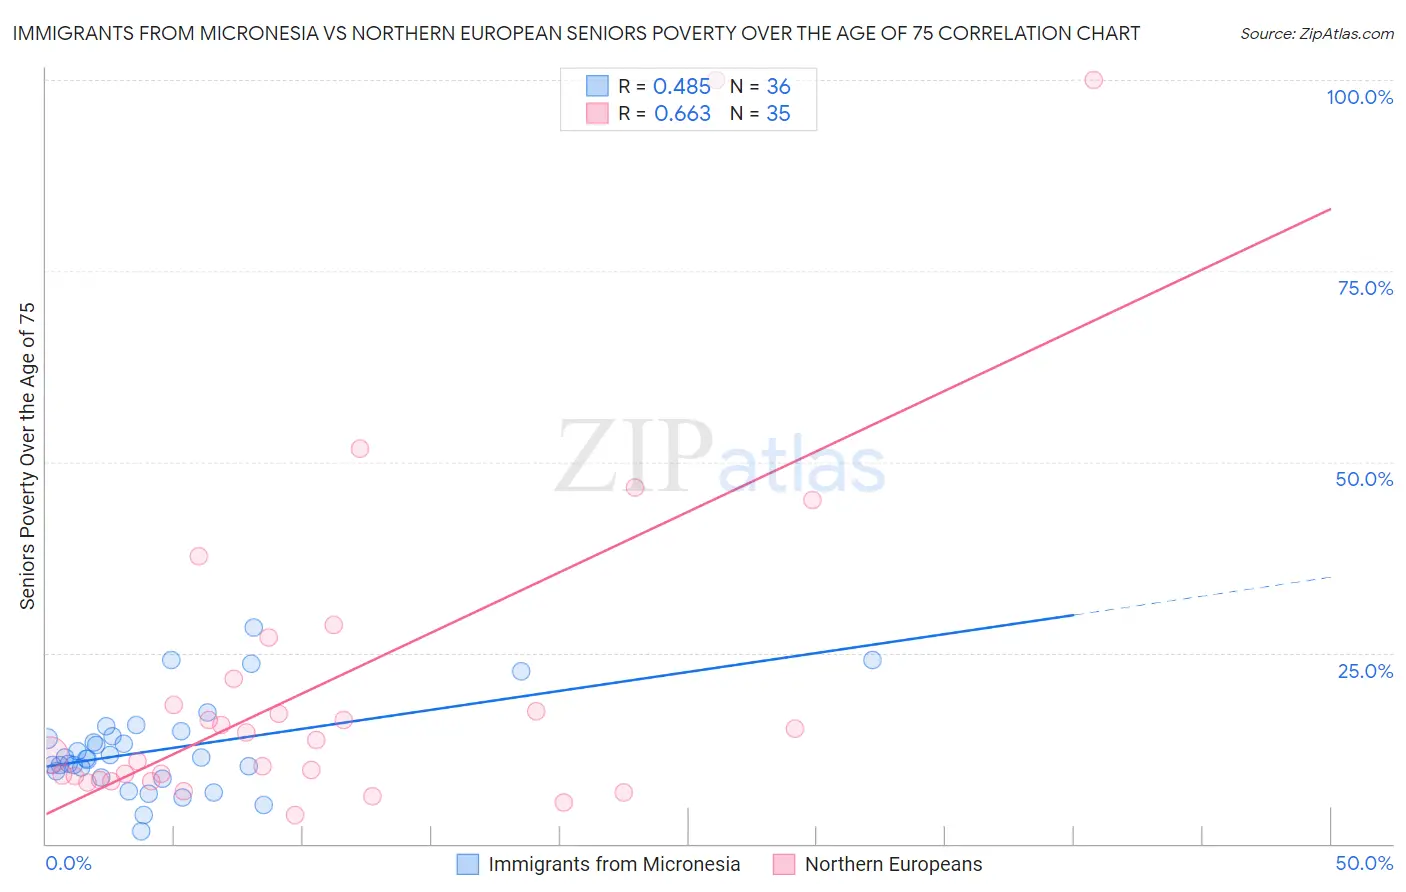
Immigrants from Micronesia vs Northern European Seniors Poverty Over the Age of 75 Correlation Chart
The statistical analysis conducted on geographies consisting of 61,139,167 people shows a moderate positive correlation between the proportion of Immigrants from Micronesia and poverty level among seniors over the age of 75 in the United States with a correlation coefficient (R) of 0.485 and weighted average of 11.4%. Similarly, the statistical analysis conducted on geographies consisting of 400,431,861 people shows a significant positive correlation between the proportion of Northern Europeans and poverty level among seniors over the age of 75 in the United States with a correlation coefficient (R) of 0.663 and weighted average of 10.7%, a difference of 6.8%.
Seniors Poverty Over the Age of 75 Correlation Summary
| Measurement | Immigrants from Micronesia | Northern European |
| Minimum | 1.7% | 3.8% |
| Maximum | 28.3% | 100.0% |
| Range | 26.6% | 96.2% |
| Mean | 12.4% | 21.2% |
| Median | 11.2% | 13.5% |
| Interquartile 25% (IQ1) | 9.1% | 8.3% |
| Interquartile 75% (IQ3) | 14.5% | 21.6% |
| Interquartile Range (IQR) | 5.4% | 13.4% |
| Standard Deviation (Sample) | 6.0% | 23.1% |
| Standard Deviation (Population) | 5.9% | 22.7% |
Similar Demographics by Seniors Poverty Over the Age of 75
Demographics Similar to Immigrants from Micronesia by Seniors Poverty Over the Age of 75
In terms of seniors poverty over the age of 75, the demographic groups most similar to Immigrants from Micronesia are Delaware (11.4%, a difference of 0.010%), Sierra Leonean (11.4%, a difference of 0.090%), Palestinian (11.4%, a difference of 0.11%), French Canadian (11.4%, a difference of 0.17%), and Osage (11.4%, a difference of 0.18%).
| Demographics | Rating | Rank | Seniors Poverty Over the Age of 75 |
| Estonians | 96.7 /100 | #66 | Exceptional 11.4% |
| Bolivians | 96.5 /100 | #67 | Exceptional 11.4% |
| Immigrants | Austria | 96.5 /100 | #68 | Exceptional 11.4% |
| Ottawa | 96.5 /100 | #69 | Exceptional 11.4% |
| Immigrants | South Central Asia | 96.4 /100 | #70 | Exceptional 11.4% |
| Osage | 96.3 /100 | #71 | Exceptional 11.4% |
| Sierra Leoneans | 96.1 /100 | #72 | Exceptional 11.4% |
| Immigrants | Micronesia | 96.0 /100 | #73 | Exceptional 11.4% |
| Delaware | 96.0 /100 | #74 | Exceptional 11.4% |
| Palestinians | 95.8 /100 | #75 | Exceptional 11.4% |
| French Canadians | 95.7 /100 | #76 | Exceptional 11.4% |
| Whites/Caucasians | 95.5 /100 | #77 | Exceptional 11.4% |
| Macedonians | 95.5 /100 | #78 | Exceptional 11.4% |
| Filipinos | 95.5 /100 | #79 | Exceptional 11.4% |
| Alaska Natives | 95.4 /100 | #80 | Exceptional 11.4% |
Demographics Similar to Northern Europeans by Seniors Poverty Over the Age of 75
In terms of seniors poverty over the age of 75, the demographic groups most similar to Northern Europeans are Irish (10.7%, a difference of 0.060%), Assyrian/Chaldean/Syriac (10.7%, a difference of 0.21%), Bulgarian (10.7%, a difference of 0.27%), Swiss (10.7%, a difference of 0.29%), and Marshallese (10.7%, a difference of 0.48%).
| Demographics | Rating | Rank | Seniors Poverty Over the Age of 75 |
| Czechs | 99.9 /100 | #20 | Exceptional 10.5% |
| Slovenes | 99.9 /100 | #21 | Exceptional 10.6% |
| Bhutanese | 99.8 /100 | #22 | Exceptional 10.6% |
| Lithuanians | 99.8 /100 | #23 | Exceptional 10.6% |
| Poles | 99.8 /100 | #24 | Exceptional 10.6% |
| Menominee | 99.8 /100 | #25 | Exceptional 10.6% |
| Bulgarians | 99.8 /100 | #26 | Exceptional 10.7% |
| Northern Europeans | 99.8 /100 | #27 | Exceptional 10.7% |
| Irish | 99.8 /100 | #28 | Exceptional 10.7% |
| Assyrians/Chaldeans/Syriacs | 99.8 /100 | #29 | Exceptional 10.7% |
| Swiss | 99.7 /100 | #30 | Exceptional 10.7% |
| Marshallese | 99.7 /100 | #31 | Exceptional 10.7% |
| British | 99.7 /100 | #32 | Exceptional 10.7% |
| Puget Sound Salish | 99.7 /100 | #33 | Exceptional 10.8% |
| Italians | 99.7 /100 | #34 | Exceptional 10.8% |