Immigrants from Micronesia vs Immigrants from Iraq Seniors Poverty Over the Age of 75
COMPARE
Immigrants from Micronesia
Immigrants from Iraq
Seniors Poverty Over the Age of 75
Seniors Poverty Over the Age of 75 Comparison
Immigrants from Micronesia
Immigrants from Iraq
11.4%
SENIORS POVERTY OVER THE AGE OF 75
96.0/ 100
METRIC RATING
73rd/ 347
METRIC RANK
11.5%
SENIORS POVERTY OVER THE AGE OF 75
94.9/ 100
METRIC RATING
84th/ 347
METRIC RANK
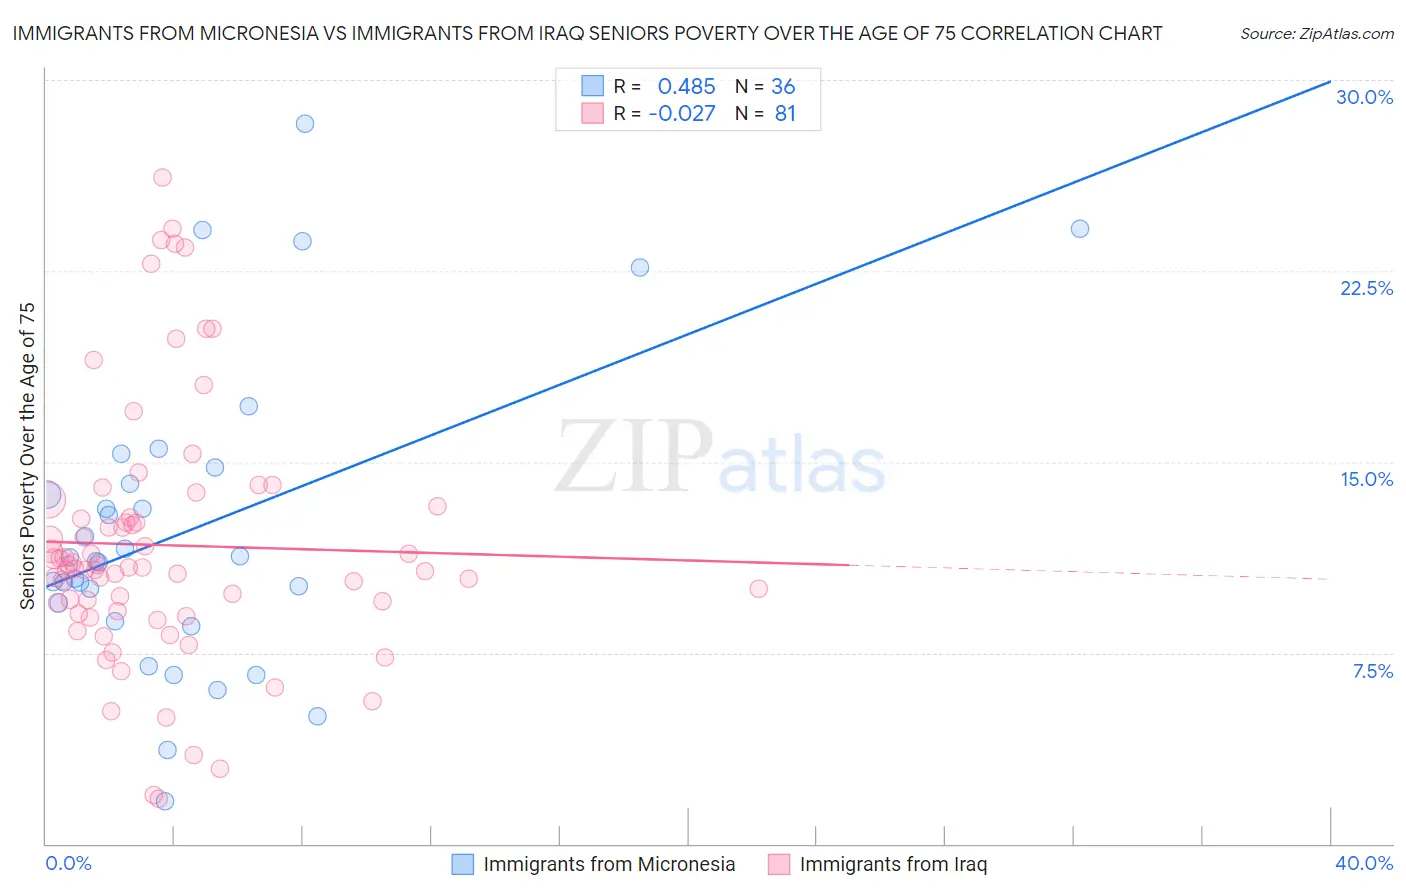
Immigrants from Micronesia vs Immigrants from Iraq Seniors Poverty Over the Age of 75 Correlation Chart
The statistical analysis conducted on geographies consisting of 61,139,167 people shows a moderate positive correlation between the proportion of Immigrants from Micronesia and poverty level among seniors over the age of 75 in the United States with a correlation coefficient (R) of 0.485 and weighted average of 11.4%. Similarly, the statistical analysis conducted on geographies consisting of 194,011,425 people shows no correlation between the proportion of Immigrants from Iraq and poverty level among seniors over the age of 75 in the United States with a correlation coefficient (R) of -0.027 and weighted average of 11.5%, a difference of 0.54%.
Seniors Poverty Over the Age of 75 Correlation Summary
| Measurement | Immigrants from Micronesia | Immigrants from Iraq |
| Minimum | 1.7% | 1.8% |
| Maximum | 28.3% | 26.2% |
| Range | 26.6% | 24.4% |
| Mean | 12.4% | 11.7% |
| Median | 11.2% | 10.9% |
| Interquartile 25% (IQ1) | 9.1% | 9.1% |
| Interquartile 75% (IQ3) | 14.5% | 13.0% |
| Interquartile Range (IQR) | 5.4% | 4.0% |
| Standard Deviation (Sample) | 6.0% | 5.0% |
| Standard Deviation (Population) | 5.9% | 5.0% |
Demographics Similar to Immigrants from Micronesia and Immigrants from Iraq by Seniors Poverty Over the Age of 75
In terms of seniors poverty over the age of 75, the demographic groups most similar to Immigrants from Micronesia are Delaware (11.4%, a difference of 0.010%), Sierra Leonean (11.4%, a difference of 0.090%), Palestinian (11.4%, a difference of 0.11%), French Canadian (11.4%, a difference of 0.17%), and Osage (11.4%, a difference of 0.18%). Similarly, the demographic groups most similar to Immigrants from Iraq are Immigrants from South Africa (11.5%, a difference of 0.0%), Iranian (11.5%, a difference of 0.090%), Basque (11.5%, a difference of 0.10%), Immigrants from Bulgaria (11.5%, a difference of 0.10%), and Australian (11.5%, a difference of 0.12%).
| Demographics | Rating | Rank | Seniors Poverty Over the Age of 75 |
| Immigrants | Austria | 96.5 /100 | #68 | Exceptional 11.4% |
| Ottawa | 96.5 /100 | #69 | Exceptional 11.4% |
| Immigrants | South Central Asia | 96.4 /100 | #70 | Exceptional 11.4% |
| Osage | 96.3 /100 | #71 | Exceptional 11.4% |
| Sierra Leoneans | 96.1 /100 | #72 | Exceptional 11.4% |
| Immigrants | Micronesia | 96.0 /100 | #73 | Exceptional 11.4% |
| Delaware | 96.0 /100 | #74 | Exceptional 11.4% |
| Palestinians | 95.8 /100 | #75 | Exceptional 11.4% |
| French Canadians | 95.7 /100 | #76 | Exceptional 11.4% |
| Whites/Caucasians | 95.5 /100 | #77 | Exceptional 11.4% |
| Macedonians | 95.5 /100 | #78 | Exceptional 11.4% |
| Filipinos | 95.5 /100 | #79 | Exceptional 11.4% |
| Alaska Natives | 95.4 /100 | #80 | Exceptional 11.4% |
| Basques | 95.1 /100 | #81 | Exceptional 11.5% |
| Iranians | 95.1 /100 | #82 | Exceptional 11.5% |
| Immigrants | South Africa | 94.9 /100 | #83 | Exceptional 11.5% |
| Immigrants | Iraq | 94.9 /100 | #84 | Exceptional 11.5% |
| Immigrants | Bulgaria | 94.7 /100 | #85 | Exceptional 11.5% |
| Australians | 94.6 /100 | #86 | Exceptional 11.5% |
| Koreans | 94.5 /100 | #87 | Exceptional 11.5% |
| Immigrants | Croatia | 94.5 /100 | #88 | Exceptional 11.5% |