Immigrants from Northern Europe vs Immigrants from Iraq Seniors Poverty Over the Age of 75
COMPARE
Immigrants from Northern Europe
Immigrants from Iraq
Seniors Poverty Over the Age of 75
Seniors Poverty Over the Age of 75 Comparison
Immigrants from Northern Europe
Immigrants from Iraq
11.3%
SENIORS POVERTY OVER THE AGE OF 75
97.4/ 100
METRIC RATING
64th/ 347
METRIC RANK
11.5%
SENIORS POVERTY OVER THE AGE OF 75
94.9/ 100
METRIC RATING
84th/ 347
METRIC RANK
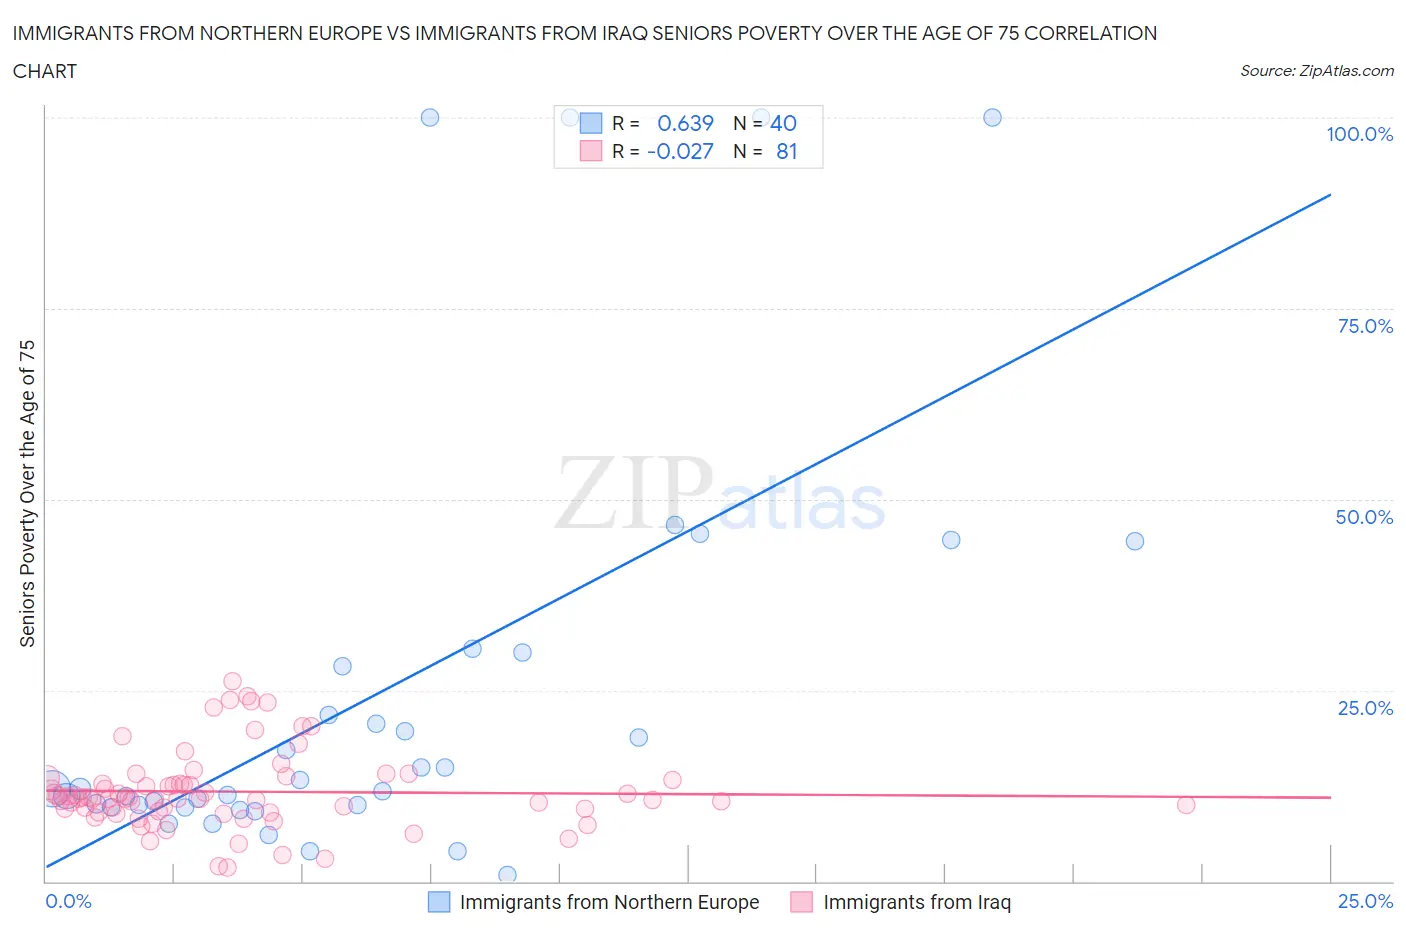
Immigrants from Northern Europe vs Immigrants from Iraq Seniors Poverty Over the Age of 75 Correlation Chart
The statistical analysis conducted on geographies consisting of 469,237,563 people shows a significant positive correlation between the proportion of Immigrants from Northern Europe and poverty level among seniors over the age of 75 in the United States with a correlation coefficient (R) of 0.639 and weighted average of 11.3%. Similarly, the statistical analysis conducted on geographies consisting of 194,011,425 people shows no correlation between the proportion of Immigrants from Iraq and poverty level among seniors over the age of 75 in the United States with a correlation coefficient (R) of -0.027 and weighted average of 11.5%, a difference of 1.5%.
Seniors Poverty Over the Age of 75 Correlation Summary
| Measurement | Immigrants from Northern Europe | Immigrants from Iraq |
| Minimum | 0.79% | 1.8% |
| Maximum | 100.0% | 26.2% |
| Range | 99.2% | 24.4% |
| Mean | 25.0% | 11.7% |
| Median | 12.1% | 10.9% |
| Interquartile 25% (IQ1) | 9.8% | 9.1% |
| Interquartile 75% (IQ3) | 29.0% | 13.0% |
| Interquartile Range (IQR) | 19.2% | 4.0% |
| Standard Deviation (Sample) | 27.9% | 5.0% |
| Standard Deviation (Population) | 27.5% | 5.0% |
Demographics Similar to Immigrants from Northern Europe and Immigrants from Iraq by Seniors Poverty Over the Age of 75
In terms of seniors poverty over the age of 75, the demographic groups most similar to Immigrants from Northern Europe are Immigrants from Taiwan (11.4%, a difference of 0.51%), Estonian (11.4%, a difference of 0.53%), Bolivian (11.4%, a difference of 0.62%), Immigrants from Austria (11.4%, a difference of 0.64%), and Ottawa (11.4%, a difference of 0.65%). Similarly, the demographic groups most similar to Immigrants from Iraq are Immigrants from South Africa (11.5%, a difference of 0.0%), Iranian (11.5%, a difference of 0.090%), Basque (11.5%, a difference of 0.10%), Alaska Native (11.4%, a difference of 0.22%), and Filipino (11.4%, a difference of 0.27%).
| Demographics | Rating | Rank | Seniors Poverty Over the Age of 75 |
| Immigrants | Northern Europe | 97.4 /100 | #64 | Exceptional 11.3% |
| Immigrants | Taiwan | 96.7 /100 | #65 | Exceptional 11.4% |
| Estonians | 96.7 /100 | #66 | Exceptional 11.4% |
| Bolivians | 96.5 /100 | #67 | Exceptional 11.4% |
| Immigrants | Austria | 96.5 /100 | #68 | Exceptional 11.4% |
| Ottawa | 96.5 /100 | #69 | Exceptional 11.4% |
| Immigrants | South Central Asia | 96.4 /100 | #70 | Exceptional 11.4% |
| Osage | 96.3 /100 | #71 | Exceptional 11.4% |
| Sierra Leoneans | 96.1 /100 | #72 | Exceptional 11.4% |
| Immigrants | Micronesia | 96.0 /100 | #73 | Exceptional 11.4% |
| Delaware | 96.0 /100 | #74 | Exceptional 11.4% |
| Palestinians | 95.8 /100 | #75 | Exceptional 11.4% |
| French Canadians | 95.7 /100 | #76 | Exceptional 11.4% |
| Whites/Caucasians | 95.5 /100 | #77 | Exceptional 11.4% |
| Macedonians | 95.5 /100 | #78 | Exceptional 11.4% |
| Filipinos | 95.5 /100 | #79 | Exceptional 11.4% |
| Alaska Natives | 95.4 /100 | #80 | Exceptional 11.4% |
| Basques | 95.1 /100 | #81 | Exceptional 11.5% |
| Iranians | 95.1 /100 | #82 | Exceptional 11.5% |
| Immigrants | South Africa | 94.9 /100 | #83 | Exceptional 11.5% |
| Immigrants | Iraq | 94.9 /100 | #84 | Exceptional 11.5% |