Immigrants from Malaysia vs Spanish Seniors Poverty Over the Age of 75
COMPARE
Immigrants from Malaysia
Spanish
Seniors Poverty Over the Age of 75
Seniors Poverty Over the Age of 75 Comparison
Immigrants from Malaysia
Spanish
12.3%
SENIORS POVERTY OVER THE AGE OF 75
35.8/ 100
METRIC RATING
185th/ 347
METRIC RANK
11.8%
SENIORS POVERTY OVER THE AGE OF 75
80.5/ 100
METRIC RATING
130th/ 347
METRIC RANK
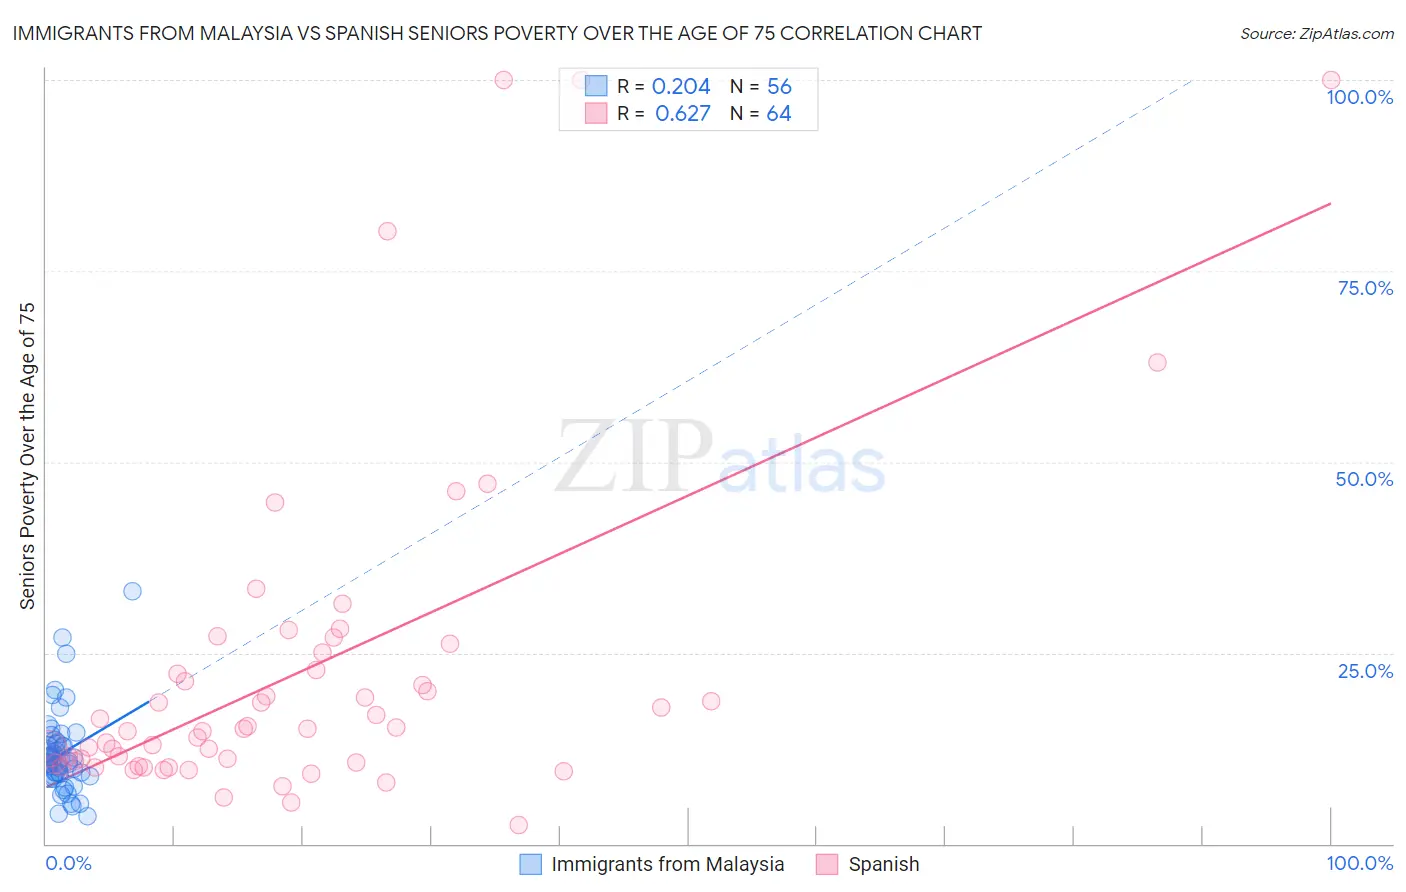
Immigrants from Malaysia vs Spanish Seniors Poverty Over the Age of 75 Correlation Chart
The statistical analysis conducted on geographies consisting of 196,850,281 people shows a weak positive correlation between the proportion of Immigrants from Malaysia and poverty level among seniors over the age of 75 in the United States with a correlation coefficient (R) of 0.204 and weighted average of 12.3%. Similarly, the statistical analysis conducted on geographies consisting of 416,617,301 people shows a significant positive correlation between the proportion of Spanish and poverty level among seniors over the age of 75 in the United States with a correlation coefficient (R) of 0.627 and weighted average of 11.8%, a difference of 4.2%.
Seniors Poverty Over the Age of 75 Correlation Summary
| Measurement | Immigrants from Malaysia | Spanish |
| Minimum | 3.6% | 2.4% |
| Maximum | 33.1% | 100.0% |
| Range | 29.6% | 97.6% |
| Mean | 11.8% | 22.6% |
| Median | 11.0% | 15.1% |
| Interquartile 25% (IQ1) | 9.0% | 10.6% |
| Interquartile 75% (IQ3) | 13.2% | 23.9% |
| Interquartile Range (IQR) | 4.2% | 13.3% |
| Standard Deviation (Sample) | 5.4% | 21.8% |
| Standard Deviation (Population) | 5.4% | 21.7% |
Similar Demographics by Seniors Poverty Over the Age of 75
Demographics Similar to Immigrants from Malaysia by Seniors Poverty Over the Age of 75
In terms of seniors poverty over the age of 75, the demographic groups most similar to Immigrants from Malaysia are Kiowa (12.3%, a difference of 0.010%), Laotian (12.3%, a difference of 0.20%), Sri Lankan (12.4%, a difference of 0.31%), German Russian (12.3%, a difference of 0.48%), and Immigrants from Australia (12.2%, a difference of 0.71%).
| Demographics | Rating | Rank | Seniors Poverty Over the Age of 75 |
| Immigrants | Nonimmigrants | 46.8 /100 | #178 | Average 12.2% |
| Mongolians | 45.5 /100 | #179 | Average 12.2% |
| Immigrants | South Eastern Asia | 44.3 /100 | #180 | Average 12.2% |
| Immigrants | Australia | 44.2 /100 | #181 | Average 12.2% |
| German Russians | 41.4 /100 | #182 | Average 12.3% |
| Laotians | 38.2 /100 | #183 | Fair 12.3% |
| Kiowa | 36.0 /100 | #184 | Fair 12.3% |
| Immigrants | Malaysia | 35.8 /100 | #185 | Fair 12.3% |
| Sri Lankans | 32.3 /100 | #186 | Fair 12.4% |
| Yaqui | 25.9 /100 | #187 | Fair 12.5% |
| Immigrants | Northern Africa | 25.2 /100 | #188 | Fair 12.5% |
| Immigrants | Indonesia | 24.4 /100 | #189 | Fair 12.5% |
| Immigrants | Congo | 23.9 /100 | #190 | Fair 12.5% |
| Liberians | 23.2 /100 | #191 | Fair 12.5% |
| Choctaw | 20.2 /100 | #192 | Fair 12.5% |
Demographics Similar to Spanish by Seniors Poverty Over the Age of 75
In terms of seniors poverty over the age of 75, the demographic groups most similar to Spanish are Ethiopian (11.8%, a difference of 0.020%), Immigrants from Western Europe (11.9%, a difference of 0.12%), Immigrants from Hungary (11.8%, a difference of 0.17%), Lebanese (11.9%, a difference of 0.28%), and Immigrants from Denmark (11.8%, a difference of 0.29%).
| Demographics | Rating | Rank | Seniors Poverty Over the Age of 75 |
| Immigrants | Italy | 84.0 /100 | #123 | Excellent 11.8% |
| Fijians | 83.8 /100 | #124 | Excellent 11.8% |
| Sudanese | 83.6 /100 | #125 | Excellent 11.8% |
| Pennsylvania Germans | 83.4 /100 | #126 | Excellent 11.8% |
| Immigrants | Denmark | 82.6 /100 | #127 | Excellent 11.8% |
| Immigrants | Hungary | 81.7 /100 | #128 | Excellent 11.8% |
| Ethiopians | 80.7 /100 | #129 | Excellent 11.8% |
| Spanish | 80.5 /100 | #130 | Excellent 11.8% |
| Immigrants | Western Europe | 79.6 /100 | #131 | Good 11.9% |
| Lebanese | 78.3 /100 | #132 | Good 11.9% |
| Immigrants | Sierra Leone | 77.6 /100 | #133 | Good 11.9% |
| Ugandans | 77.1 /100 | #134 | Good 11.9% |
| Immigrants | Ireland | 76.2 /100 | #135 | Good 11.9% |
| Immigrants | Philippines | 75.0 /100 | #136 | Good 11.9% |
| Immigrants | Moldova | 74.1 /100 | #137 | Good 11.9% |