Asian vs Spanish Seniors Poverty Over the Age of 75
COMPARE
Asian
Spanish
Seniors Poverty Over the Age of 75
Seniors Poverty Over the Age of 75 Comparison
Asians
Spanish
12.0%
SENIORS POVERTY OVER THE AGE OF 75
67.4/ 100
METRIC RATING
149th/ 347
METRIC RANK
11.8%
SENIORS POVERTY OVER THE AGE OF 75
80.5/ 100
METRIC RATING
130th/ 347
METRIC RANK
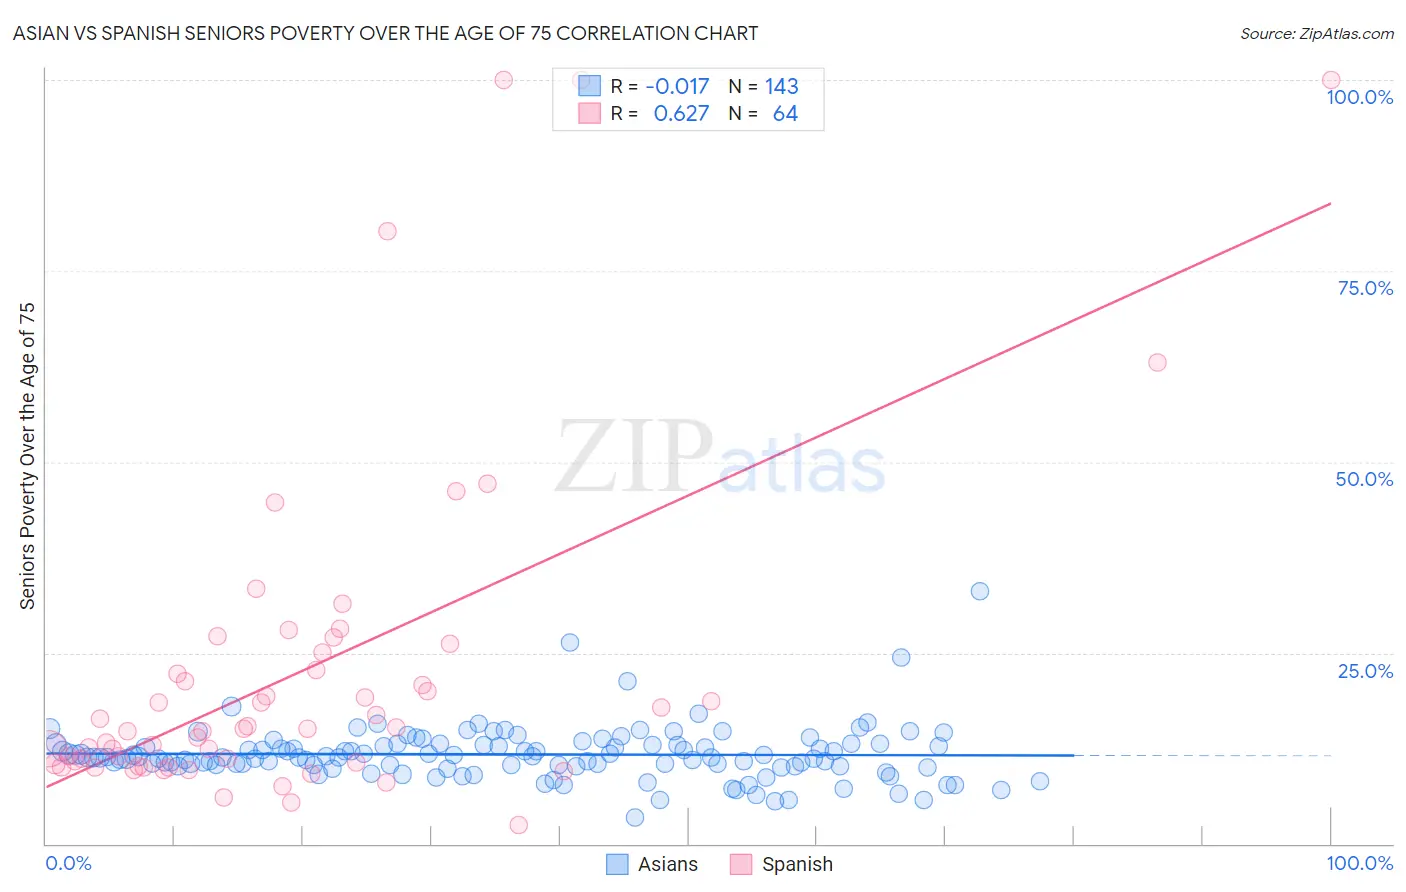
Asian vs Spanish Seniors Poverty Over the Age of 75 Correlation Chart
The statistical analysis conducted on geographies consisting of 537,471,645 people shows no correlation between the proportion of Asians and poverty level among seniors over the age of 75 in the United States with a correlation coefficient (R) of -0.017 and weighted average of 12.0%. Similarly, the statistical analysis conducted on geographies consisting of 416,617,301 people shows a significant positive correlation between the proportion of Spanish and poverty level among seniors over the age of 75 in the United States with a correlation coefficient (R) of 0.627 and weighted average of 11.8%, a difference of 1.4%.
Seniors Poverty Over the Age of 75 Correlation Summary
| Measurement | Asian | Spanish |
| Minimum | 3.4% | 2.4% |
| Maximum | 33.1% | 100.0% |
| Range | 29.7% | 97.6% |
| Mean | 11.7% | 22.6% |
| Median | 11.4% | 15.1% |
| Interquartile 25% (IQ1) | 10.2% | 10.6% |
| Interquartile 75% (IQ3) | 12.9% | 23.9% |
| Interquartile Range (IQR) | 2.7% | 13.3% |
| Standard Deviation (Sample) | 3.6% | 21.8% |
| Standard Deviation (Population) | 3.6% | 21.7% |
Demographics Similar to Asians and Spanish by Seniors Poverty Over the Age of 75
In terms of seniors poverty over the age of 75, the demographic groups most similar to Asians are Immigrants from Zaire (12.0%, a difference of 0.020%), Immigrants from Latvia (12.0%, a difference of 0.16%), Bangladeshi (12.0%, a difference of 0.28%), Hmong (12.0%, a difference of 0.33%), and Immigrants from Belgium (12.0%, a difference of 0.33%). Similarly, the demographic groups most similar to Spanish are Ethiopian (11.8%, a difference of 0.020%), Immigrants from Western Europe (11.9%, a difference of 0.12%), Lebanese (11.9%, a difference of 0.28%), Immigrants from Sierra Leone (11.9%, a difference of 0.37%), and Ugandan (11.9%, a difference of 0.43%).
| Demographics | Rating | Rank | Seniors Poverty Over the Age of 75 |
| Ethiopians | 80.7 /100 | #129 | Excellent 11.8% |
| Spanish | 80.5 /100 | #130 | Excellent 11.8% |
| Immigrants | Western Europe | 79.6 /100 | #131 | Good 11.9% |
| Lebanese | 78.3 /100 | #132 | Good 11.9% |
| Immigrants | Sierra Leone | 77.6 /100 | #133 | Good 11.9% |
| Ugandans | 77.1 /100 | #134 | Good 11.9% |
| Immigrants | Ireland | 76.2 /100 | #135 | Good 11.9% |
| Immigrants | Philippines | 75.0 /100 | #136 | Good 11.9% |
| Immigrants | Moldova | 74.1 /100 | #137 | Good 11.9% |
| Immigrants | Romania | 72.6 /100 | #138 | Good 11.9% |
| Immigrants | Kenya | 72.6 /100 | #139 | Good 11.9% |
| Immigrants | Pakistan | 71.9 /100 | #140 | Good 12.0% |
| Immigrants | Cameroon | 71.7 /100 | #141 | Good 12.0% |
| Immigrants | Laos | 71.5 /100 | #142 | Good 12.0% |
| Americans | 71.0 /100 | #143 | Good 12.0% |
| Hmong | 70.8 /100 | #144 | Good 12.0% |
| Immigrants | Belgium | 70.8 /100 | #145 | Good 12.0% |
| Bangladeshis | 70.4 /100 | #146 | Good 12.0% |
| Immigrants | Latvia | 69.1 /100 | #147 | Good 12.0% |
| Immigrants | Zaire | 67.6 /100 | #148 | Good 12.0% |
| Asians | 67.4 /100 | #149 | Good 12.0% |