Immigrants from Malaysia vs Immigrants from Yemen Seniors Poverty Over the Age of 75
COMPARE
Immigrants from Malaysia
Immigrants from Yemen
Seniors Poverty Over the Age of 75
Seniors Poverty Over the Age of 75 Comparison
Immigrants from Malaysia
Immigrants from Yemen
12.3%
SENIORS POVERTY OVER THE AGE OF 75
35.8/ 100
METRIC RATING
185th/ 347
METRIC RANK
16.5%
SENIORS POVERTY OVER THE AGE OF 75
0.0/ 100
METRIC RATING
320th/ 347
METRIC RANK
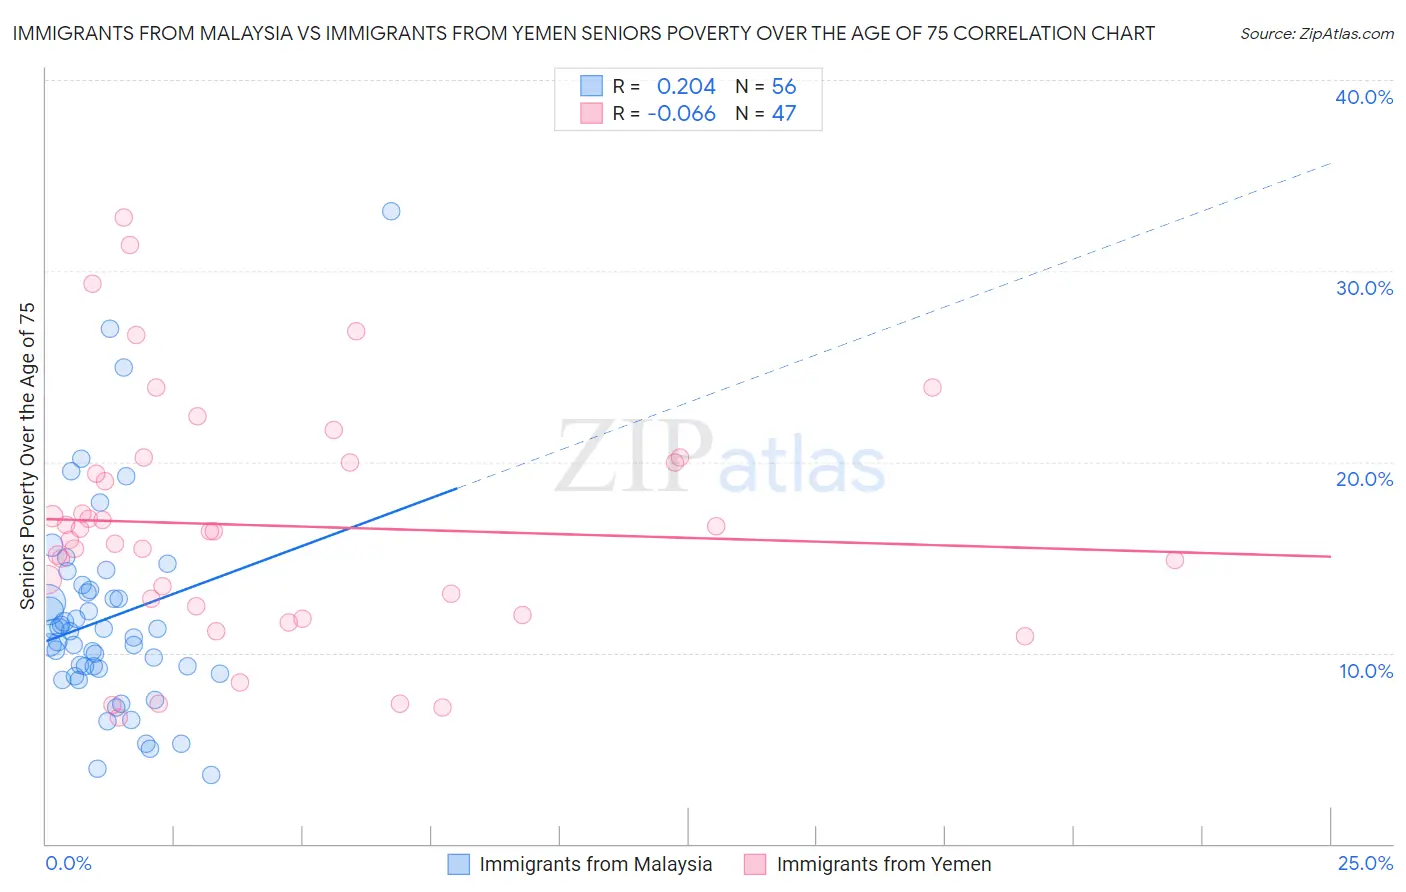
Immigrants from Malaysia vs Immigrants from Yemen Seniors Poverty Over the Age of 75 Correlation Chart
The statistical analysis conducted on geographies consisting of 196,850,281 people shows a weak positive correlation between the proportion of Immigrants from Malaysia and poverty level among seniors over the age of 75 in the United States with a correlation coefficient (R) of 0.204 and weighted average of 12.3%. Similarly, the statistical analysis conducted on geographies consisting of 82,233,143 people shows a slight negative correlation between the proportion of Immigrants from Yemen and poverty level among seniors over the age of 75 in the United States with a correlation coefficient (R) of -0.066 and weighted average of 16.5%, a difference of 33.7%.
Seniors Poverty Over the Age of 75 Correlation Summary
| Measurement | Immigrants from Malaysia | Immigrants from Yemen |
| Minimum | 3.6% | 6.6% |
| Maximum | 33.1% | 32.8% |
| Range | 29.6% | 26.2% |
| Mean | 11.8% | 16.7% |
| Median | 11.0% | 16.4% |
| Interquartile 25% (IQ1) | 9.0% | 12.4% |
| Interquartile 75% (IQ3) | 13.2% | 20.0% |
| Interquartile Range (IQR) | 4.2% | 7.6% |
| Standard Deviation (Sample) | 5.4% | 6.3% |
| Standard Deviation (Population) | 5.4% | 6.2% |
Similar Demographics by Seniors Poverty Over the Age of 75
Demographics Similar to Immigrants from Malaysia by Seniors Poverty Over the Age of 75
In terms of seniors poverty over the age of 75, the demographic groups most similar to Immigrants from Malaysia are Kiowa (12.3%, a difference of 0.010%), Laotian (12.3%, a difference of 0.20%), Sri Lankan (12.4%, a difference of 0.31%), German Russian (12.3%, a difference of 0.48%), and Immigrants from Australia (12.2%, a difference of 0.71%).
| Demographics | Rating | Rank | Seniors Poverty Over the Age of 75 |
| Immigrants | Nonimmigrants | 46.8 /100 | #178 | Average 12.2% |
| Mongolians | 45.5 /100 | #179 | Average 12.2% |
| Immigrants | South Eastern Asia | 44.3 /100 | #180 | Average 12.2% |
| Immigrants | Australia | 44.2 /100 | #181 | Average 12.2% |
| German Russians | 41.4 /100 | #182 | Average 12.3% |
| Laotians | 38.2 /100 | #183 | Fair 12.3% |
| Kiowa | 36.0 /100 | #184 | Fair 12.3% |
| Immigrants | Malaysia | 35.8 /100 | #185 | Fair 12.3% |
| Sri Lankans | 32.3 /100 | #186 | Fair 12.4% |
| Yaqui | 25.9 /100 | #187 | Fair 12.5% |
| Immigrants | Northern Africa | 25.2 /100 | #188 | Fair 12.5% |
| Immigrants | Indonesia | 24.4 /100 | #189 | Fair 12.5% |
| Immigrants | Congo | 23.9 /100 | #190 | Fair 12.5% |
| Liberians | 23.2 /100 | #191 | Fair 12.5% |
| Choctaw | 20.2 /100 | #192 | Fair 12.5% |
Demographics Similar to Immigrants from Yemen by Seniors Poverty Over the Age of 75
In terms of seniors poverty over the age of 75, the demographic groups most similar to Immigrants from Yemen are Immigrants from Haiti (16.5%, a difference of 0.18%), Immigrants from Barbados (16.5%, a difference of 0.21%), Central American Indian (16.5%, a difference of 0.30%), Immigrants from Uzbekistan (16.5%, a difference of 0.35%), and Nicaraguan (16.6%, a difference of 0.73%).
| Demographics | Rating | Rank | Seniors Poverty Over the Age of 75 |
| Barbadians | 0.0 /100 | #313 | Tragic 16.0% |
| Tsimshian | 0.0 /100 | #314 | Tragic 16.1% |
| Guyanese | 0.0 /100 | #315 | Tragic 16.1% |
| Immigrants | Ecuador | 0.0 /100 | #316 | Tragic 16.1% |
| Immigrants | Guyana | 0.0 /100 | #317 | Tragic 16.2% |
| Houma | 0.0 /100 | #318 | Tragic 16.2% |
| Haitians | 0.0 /100 | #319 | Tragic 16.2% |
| Immigrants | Yemen | 0.0 /100 | #320 | Tragic 16.5% |
| Immigrants | Haiti | 0.0 /100 | #321 | Tragic 16.5% |
| Immigrants | Barbados | 0.0 /100 | #322 | Tragic 16.5% |
| Central American Indians | 0.0 /100 | #323 | Tragic 16.5% |
| Immigrants | Uzbekistan | 0.0 /100 | #324 | Tragic 16.5% |
| Nicaraguans | 0.0 /100 | #325 | Tragic 16.6% |
| Pueblo | 0.0 /100 | #326 | Tragic 16.7% |
| Sioux | 0.0 /100 | #327 | Tragic 16.8% |