Immigrants from Malaysia vs Potawatomi Seniors Poverty Over the Age of 65
COMPARE
Immigrants from Malaysia
Potawatomi
Seniors Poverty Over the Age of 65
Seniors Poverty Over the Age of 65 Comparison
Immigrants from Malaysia
Potawatomi
11.0%
SENIORS POVERTY OVER THE AGE OF 65
47.9/ 100
METRIC RATING
176th/ 347
METRIC RANK
10.8%
SENIORS POVERTY OVER THE AGE OF 65
62.6/ 100
METRIC RATING
164th/ 347
METRIC RANK
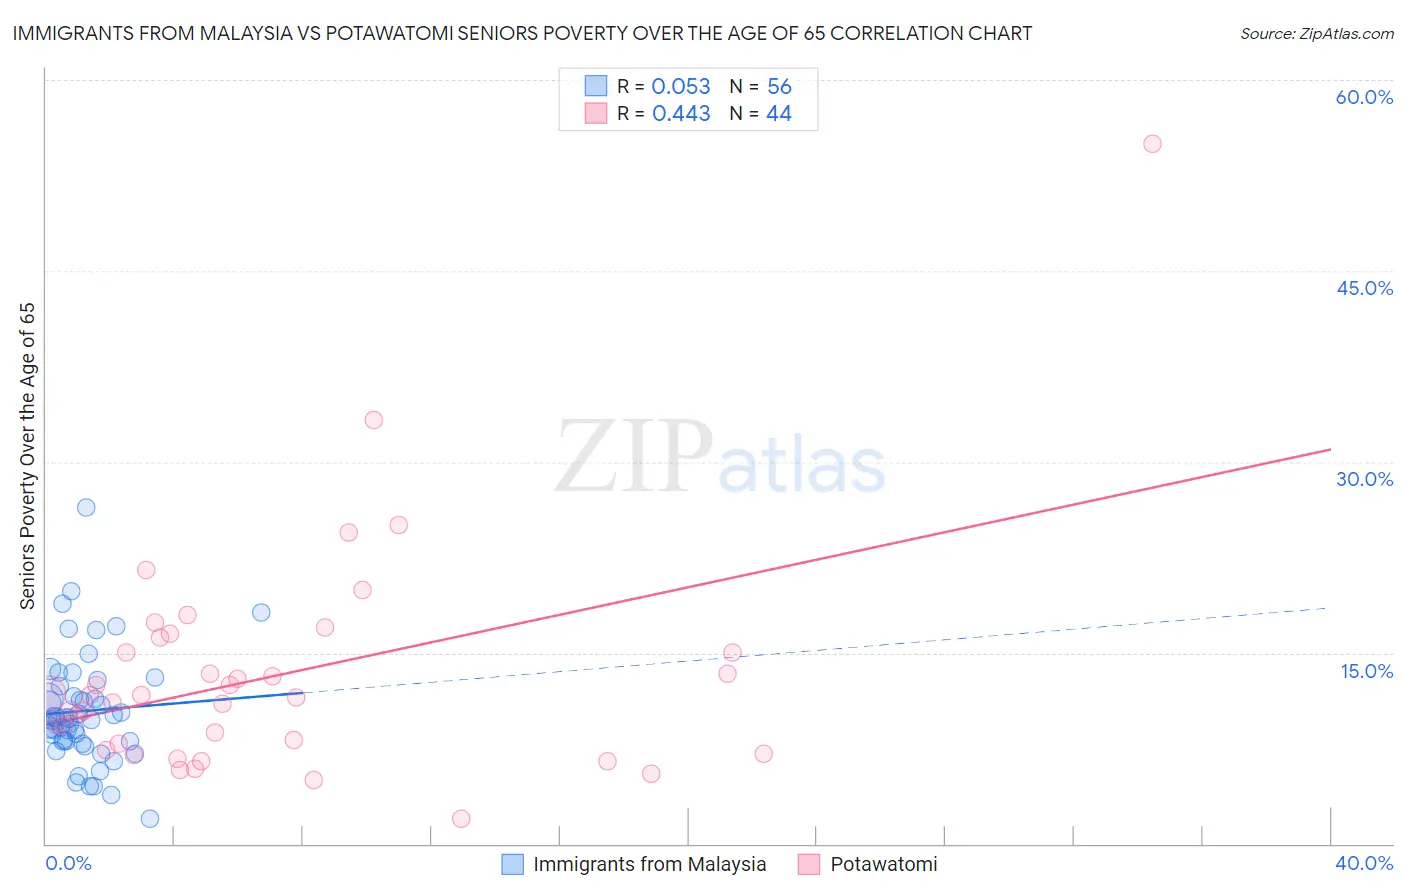
Immigrants from Malaysia vs Potawatomi Seniors Poverty Over the Age of 65 Correlation Chart
The statistical analysis conducted on geographies consisting of 197,703,673 people shows a slight positive correlation between the proportion of Immigrants from Malaysia and poverty level among seniors over the age of 65 in the United States with a correlation coefficient (R) of 0.053 and weighted average of 11.0%. Similarly, the statistical analysis conducted on geographies consisting of 117,657,518 people shows a moderate positive correlation between the proportion of Potawatomi and poverty level among seniors over the age of 65 in the United States with a correlation coefficient (R) of 0.443 and weighted average of 10.8%, a difference of 1.3%.
Seniors Poverty Over the Age of 65 Correlation Summary
| Measurement | Immigrants from Malaysia | Potawatomi |
| Minimum | 1.9% | 1.9% |
| Maximum | 26.4% | 55.0% |
| Range | 24.5% | 53.1% |
| Mean | 10.4% | 13.2% |
| Median | 9.8% | 11.6% |
| Interquartile 25% (IQ1) | 8.1% | 7.6% |
| Interquartile 75% (IQ3) | 12.0% | 15.6% |
| Interquartile Range (IQR) | 3.9% | 8.0% |
| Standard Deviation (Sample) | 4.3% | 8.8% |
| Standard Deviation (Population) | 4.3% | 8.7% |
Demographics Similar to Immigrants from Malaysia and Potawatomi by Seniors Poverty Over the Age of 65
In terms of seniors poverty over the age of 65, the demographic groups most similar to Immigrants from Malaysia are Cherokee (11.0%, a difference of 0.050%), German Russian (11.0%, a difference of 0.090%), Creek (10.9%, a difference of 0.15%), Immigrants from Sudan (10.9%, a difference of 0.19%), and Spaniard (10.9%, a difference of 0.25%). Similarly, the demographic groups most similar to Potawatomi are Immigrants from South Eastern Asia (10.8%, a difference of 0.050%), Malaysian (10.8%, a difference of 0.060%), Tsimshian (10.8%, a difference of 0.19%), Immigrants from Indonesia (10.8%, a difference of 0.22%), and Alaska Native (10.8%, a difference of 0.22%).
| Demographics | Rating | Rank | Seniors Poverty Over the Age of 65 |
| Sudanese | 68.2 /100 | #160 | Good 10.7% |
| Arabs | 65.2 /100 | #161 | Good 10.8% |
| Immigrants | Indonesia | 64.8 /100 | #162 | Good 10.8% |
| Tsimshian | 64.5 /100 | #163 | Good 10.8% |
| Potawatomi | 62.6 /100 | #164 | Good 10.8% |
| Immigrants | South Eastern Asia | 62.1 /100 | #165 | Good 10.8% |
| Malaysians | 62.0 /100 | #166 | Good 10.8% |
| Alaska Natives | 60.3 /100 | #167 | Good 10.8% |
| Mongolians | 58.0 /100 | #168 | Average 10.9% |
| Sri Lankans | 56.8 /100 | #169 | Average 10.9% |
| Immigrants | Eastern Europe | 55.8 /100 | #170 | Average 10.9% |
| Immigrants | Nonimmigrants | 55.1 /100 | #171 | Average 10.9% |
| Immigrants | Syria | 54.7 /100 | #172 | Average 10.9% |
| Spaniards | 50.7 /100 | #173 | Average 10.9% |
| Immigrants | Sudan | 50.0 /100 | #174 | Average 10.9% |
| Creek | 49.6 /100 | #175 | Average 10.9% |
| Immigrants | Malaysia | 47.9 /100 | #176 | Average 11.0% |
| Cherokee | 47.3 /100 | #177 | Average 11.0% |
| German Russians | 46.9 /100 | #178 | Average 11.0% |
| Immigrants | Northern Africa | 44.6 /100 | #179 | Average 11.0% |
| Immigrants | Thailand | 43.5 /100 | #180 | Average 11.0% |