Immigrants from Malaysia vs Cajun Seniors Poverty Over the Age of 65
COMPARE
Immigrants from Malaysia
Cajun
Seniors Poverty Over the Age of 65
Seniors Poverty Over the Age of 65 Comparison
Immigrants from Malaysia
Cajuns
11.0%
SENIORS POVERTY OVER THE AGE OF 65
47.9/ 100
METRIC RATING
176th/ 347
METRIC RANK
11.9%
SENIORS POVERTY OVER THE AGE OF 65
2.0/ 100
METRIC RATING
231st/ 347
METRIC RANK
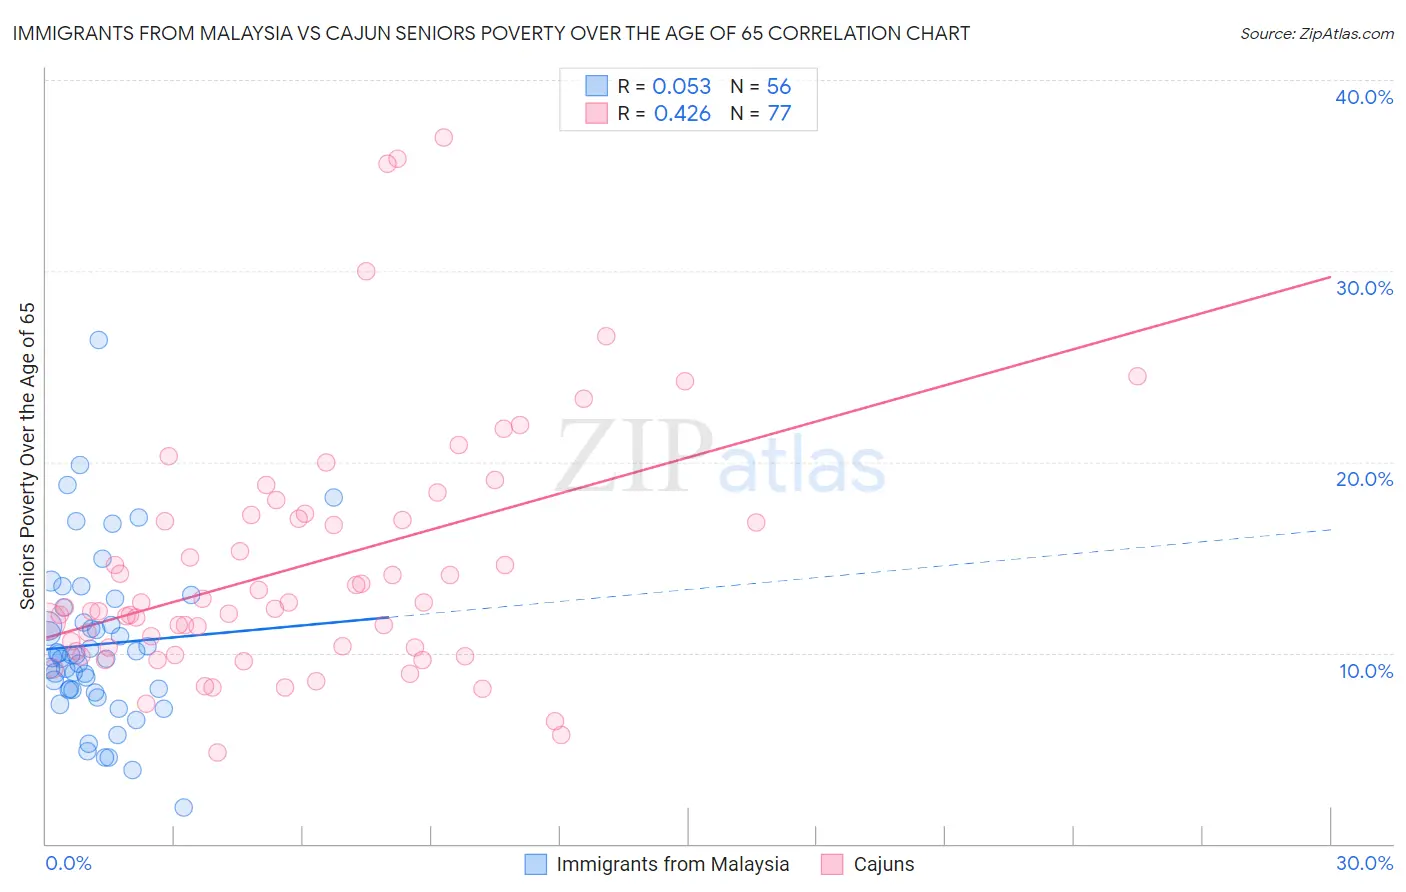
Immigrants from Malaysia vs Cajun Seniors Poverty Over the Age of 65 Correlation Chart
The statistical analysis conducted on geographies consisting of 197,703,673 people shows a slight positive correlation between the proportion of Immigrants from Malaysia and poverty level among seniors over the age of 65 in the United States with a correlation coefficient (R) of 0.053 and weighted average of 11.0%. Similarly, the statistical analysis conducted on geographies consisting of 149,395,455 people shows a moderate positive correlation between the proportion of Cajuns and poverty level among seniors over the age of 65 in the United States with a correlation coefficient (R) of 0.426 and weighted average of 11.9%, a difference of 8.4%.
Seniors Poverty Over the Age of 65 Correlation Summary
| Measurement | Immigrants from Malaysia | Cajun |
| Minimum | 1.9% | 4.8% |
| Maximum | 26.4% | 37.0% |
| Range | 24.5% | 32.2% |
| Mean | 10.4% | 14.5% |
| Median | 9.8% | 12.4% |
| Interquartile 25% (IQ1) | 8.1% | 10.2% |
| Interquartile 75% (IQ3) | 12.0% | 17.1% |
| Interquartile Range (IQR) | 3.9% | 6.9% |
| Standard Deviation (Sample) | 4.3% | 6.6% |
| Standard Deviation (Population) | 4.3% | 6.6% |
Similar Demographics by Seniors Poverty Over the Age of 65
Demographics Similar to Immigrants from Malaysia by Seniors Poverty Over the Age of 65
In terms of seniors poverty over the age of 65, the demographic groups most similar to Immigrants from Malaysia are Cherokee (11.0%, a difference of 0.050%), German Russian (11.0%, a difference of 0.090%), Creek (10.9%, a difference of 0.15%), Immigrants from Sudan (10.9%, a difference of 0.19%), and Spaniard (10.9%, a difference of 0.25%).
| Demographics | Rating | Rank | Seniors Poverty Over the Age of 65 |
| Sri Lankans | 56.8 /100 | #169 | Average 10.9% |
| Immigrants | Eastern Europe | 55.8 /100 | #170 | Average 10.9% |
| Immigrants | Nonimmigrants | 55.1 /100 | #171 | Average 10.9% |
| Immigrants | Syria | 54.7 /100 | #172 | Average 10.9% |
| Spaniards | 50.7 /100 | #173 | Average 10.9% |
| Immigrants | Sudan | 50.0 /100 | #174 | Average 10.9% |
| Creek | 49.6 /100 | #175 | Average 10.9% |
| Immigrants | Malaysia | 47.9 /100 | #176 | Average 11.0% |
| Cherokee | 47.3 /100 | #177 | Average 11.0% |
| German Russians | 46.9 /100 | #178 | Average 11.0% |
| Immigrants | Northern Africa | 44.6 /100 | #179 | Average 11.0% |
| Immigrants | Thailand | 43.5 /100 | #180 | Average 11.0% |
| Immigrants | Eastern Africa | 43.4 /100 | #181 | Average 11.0% |
| Immigrants | Fiji | 42.0 /100 | #182 | Average 11.0% |
| Immigrants | Kazakhstan | 41.0 /100 | #183 | Average 11.0% |
Demographics Similar to Cajuns by Seniors Poverty Over the Age of 65
In terms of seniors poverty over the age of 65, the demographic groups most similar to Cajuns are Bermudan (11.9%, a difference of 0.050%), Yaqui (11.9%, a difference of 0.14%), Panamanian (11.9%, a difference of 0.24%), Iroquois (11.9%, a difference of 0.33%), and Immigrants from Eritrea (11.8%, a difference of 0.55%).
| Demographics | Rating | Rank | Seniors Poverty Over the Age of 65 |
| Immigrants | Nigeria | 3.4 /100 | #224 | Tragic 11.7% |
| Immigrants | Belarus | 3.2 /100 | #225 | Tragic 11.8% |
| Liberians | 3.2 /100 | #226 | Tragic 11.8% |
| Nigerians | 3.2 /100 | #227 | Tragic 11.8% |
| Immigrants | Costa Rica | 2.7 /100 | #228 | Tragic 11.8% |
| Immigrants | Eritrea | 2.6 /100 | #229 | Tragic 11.8% |
| Bermudans | 2.1 /100 | #230 | Tragic 11.9% |
| Cajuns | 2.0 /100 | #231 | Tragic 11.9% |
| Yaqui | 1.9 /100 | #232 | Tragic 11.9% |
| Panamanians | 1.8 /100 | #233 | Tragic 11.9% |
| Iroquois | 1.7 /100 | #234 | Tragic 11.9% |
| Immigrants | Argentina | 1.3 /100 | #235 | Tragic 12.0% |
| Immigrants | Peru | 1.3 /100 | #236 | Tragic 12.0% |
| Moroccans | 1.2 /100 | #237 | Tragic 12.0% |
| Seminole | 1.1 /100 | #238 | Tragic 12.0% |