Immigrants from Lithuania vs French Canadian Single Father Poverty
COMPARE
Immigrants from Lithuania
French Canadian
Single Father Poverty
Single Father Poverty Comparison
Immigrants from Lithuania
French Canadians
15.3%
SINGLE FATHER POVERTY
99.6/ 100
METRIC RATING
72nd/ 347
METRIC RANK
18.6%
SINGLE FATHER POVERTY
0.0/ 100
METRIC RATING
307th/ 347
METRIC RANK
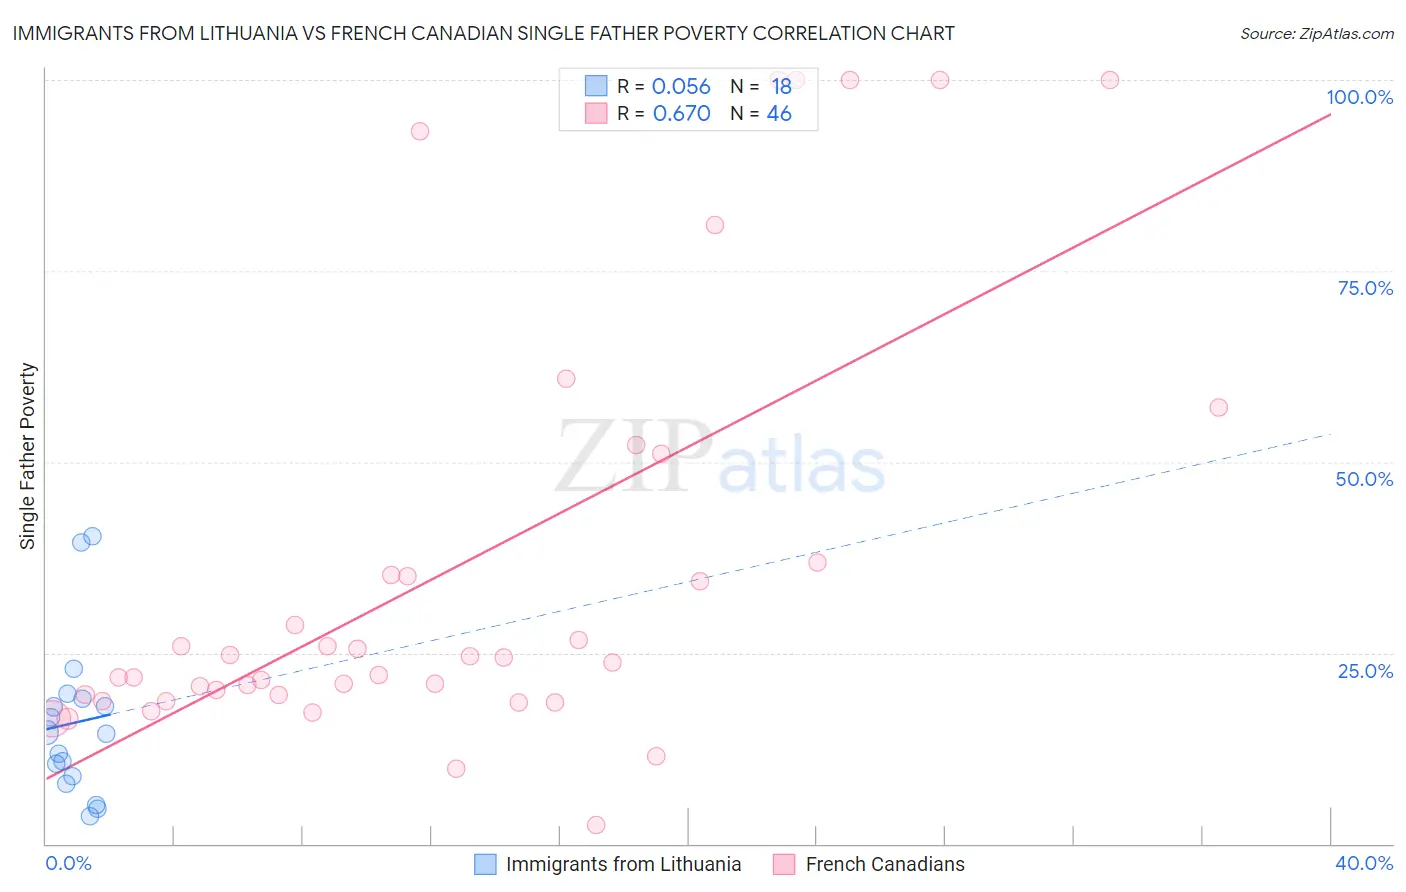
Immigrants from Lithuania vs French Canadian Single Father Poverty Correlation Chart
The statistical analysis conducted on geographies consisting of 100,005,444 people shows a slight positive correlation between the proportion of Immigrants from Lithuania and poverty level among single fathers in the United States with a correlation coefficient (R) of 0.056 and weighted average of 15.3%. Similarly, the statistical analysis conducted on geographies consisting of 372,635,885 people shows a significant positive correlation between the proportion of French Canadians and poverty level among single fathers in the United States with a correlation coefficient (R) of 0.670 and weighted average of 18.6%, a difference of 21.3%.
Single Father Poverty Correlation Summary
| Measurement | Immigrants from Lithuania | French Canadian |
| Minimum | 3.6% | 2.5% |
| Maximum | 40.2% | 100.0% |
| Range | 36.6% | 97.5% |
| Mean | 15.9% | 36.1% |
| Median | 14.4% | 24.1% |
| Interquartile 25% (IQ1) | 8.9% | 19.5% |
| Interquartile 75% (IQ3) | 18.9% | 36.8% |
| Interquartile Range (IQR) | 10.1% | 17.3% |
| Standard Deviation (Sample) | 10.3% | 28.3% |
| Standard Deviation (Population) | 10.0% | 28.0% |
Similar Demographics by Single Father Poverty
Demographics Similar to Immigrants from Lithuania by Single Father Poverty
In terms of single father poverty, the demographic groups most similar to Immigrants from Lithuania are Kenyan (15.3%, a difference of 0.090%), Immigrants from Brazil (15.3%, a difference of 0.12%), Maltese (15.3%, a difference of 0.13%), Immigrants from Turkey (15.3%, a difference of 0.15%), and Immigrants from Japan (15.3%, a difference of 0.23%).
| Demographics | Rating | Rank | Single Father Poverty |
| Immigrants | Malaysia | 99.8 /100 | #65 | Exceptional 15.2% |
| Immigrants | Moldova | 99.8 /100 | #66 | Exceptional 15.2% |
| Paraguayans | 99.7 /100 | #67 | Exceptional 15.2% |
| Immigrants | Cameroon | 99.7 /100 | #68 | Exceptional 15.2% |
| Japanese | 99.7 /100 | #69 | Exceptional 15.2% |
| Mongolians | 99.7 /100 | #70 | Exceptional 15.3% |
| Immigrants | Brazil | 99.6 /100 | #71 | Exceptional 15.3% |
| Immigrants | Lithuania | 99.6 /100 | #72 | Exceptional 15.3% |
| Kenyans | 99.6 /100 | #73 | Exceptional 15.3% |
| Maltese | 99.6 /100 | #74 | Exceptional 15.3% |
| Immigrants | Turkey | 99.5 /100 | #75 | Exceptional 15.3% |
| Immigrants | Japan | 99.5 /100 | #76 | Exceptional 15.3% |
| Immigrants | Peru | 99.5 /100 | #77 | Exceptional 15.3% |
| Tlingit-Haida | 99.5 /100 | #78 | Exceptional 15.3% |
| Immigrants | Northern Africa | 99.5 /100 | #79 | Exceptional 15.3% |
Demographics Similar to French Canadians by Single Father Poverty
In terms of single father poverty, the demographic groups most similar to French Canadians are Ottawa (18.6%, a difference of 0.020%), Scotch-Irish (18.6%, a difference of 0.040%), Immigrants from Micronesia (18.6%, a difference of 0.13%), Blackfeet (18.5%, a difference of 0.26%), and Ute (18.5%, a difference of 0.31%).
| Demographics | Rating | Rank | Single Father Poverty |
| Immigrants | Dominican Republic | 0.0 /100 | #300 | Tragic 18.4% |
| Hungarians | 0.0 /100 | #301 | Tragic 18.5% |
| Comanche | 0.0 /100 | #302 | Tragic 18.5% |
| Celtics | 0.0 /100 | #303 | Tragic 18.5% |
| Ute | 0.0 /100 | #304 | Tragic 18.5% |
| Blackfeet | 0.0 /100 | #305 | Tragic 18.5% |
| Scotch-Irish | 0.0 /100 | #306 | Tragic 18.6% |
| French Canadians | 0.0 /100 | #307 | Tragic 18.6% |
| Ottawa | 0.0 /100 | #308 | Tragic 18.6% |
| Immigrants | Micronesia | 0.0 /100 | #309 | Tragic 18.6% |
| Chippewa | 0.0 /100 | #310 | Tragic 18.8% |
| Immigrants | Nonimmigrants | 0.0 /100 | #311 | Tragic 18.8% |
| Immigrants | Dominica | 0.0 /100 | #312 | Tragic 18.9% |
| Potawatomi | 0.0 /100 | #313 | Tragic 18.9% |
| Delaware | 0.0 /100 | #314 | Tragic 18.9% |