Immigrants from Lebanon vs Sri Lankan Child Poverty Under the Age of 16
COMPARE
Immigrants from Lebanon
Sri Lankan
Child Poverty Under the Age of 16
Child Poverty Under the Age of 16 Comparison
Immigrants from Lebanon
Sri Lankans
16.8%
CHILD POVERTY UNDER THE AGE OF 16
22.0/ 100
METRIC RATING
196th/ 347
METRIC RANK
14.9%
CHILD POVERTY UNDER THE AGE OF 16
93.2/ 100
METRIC RATING
114th/ 347
METRIC RANK
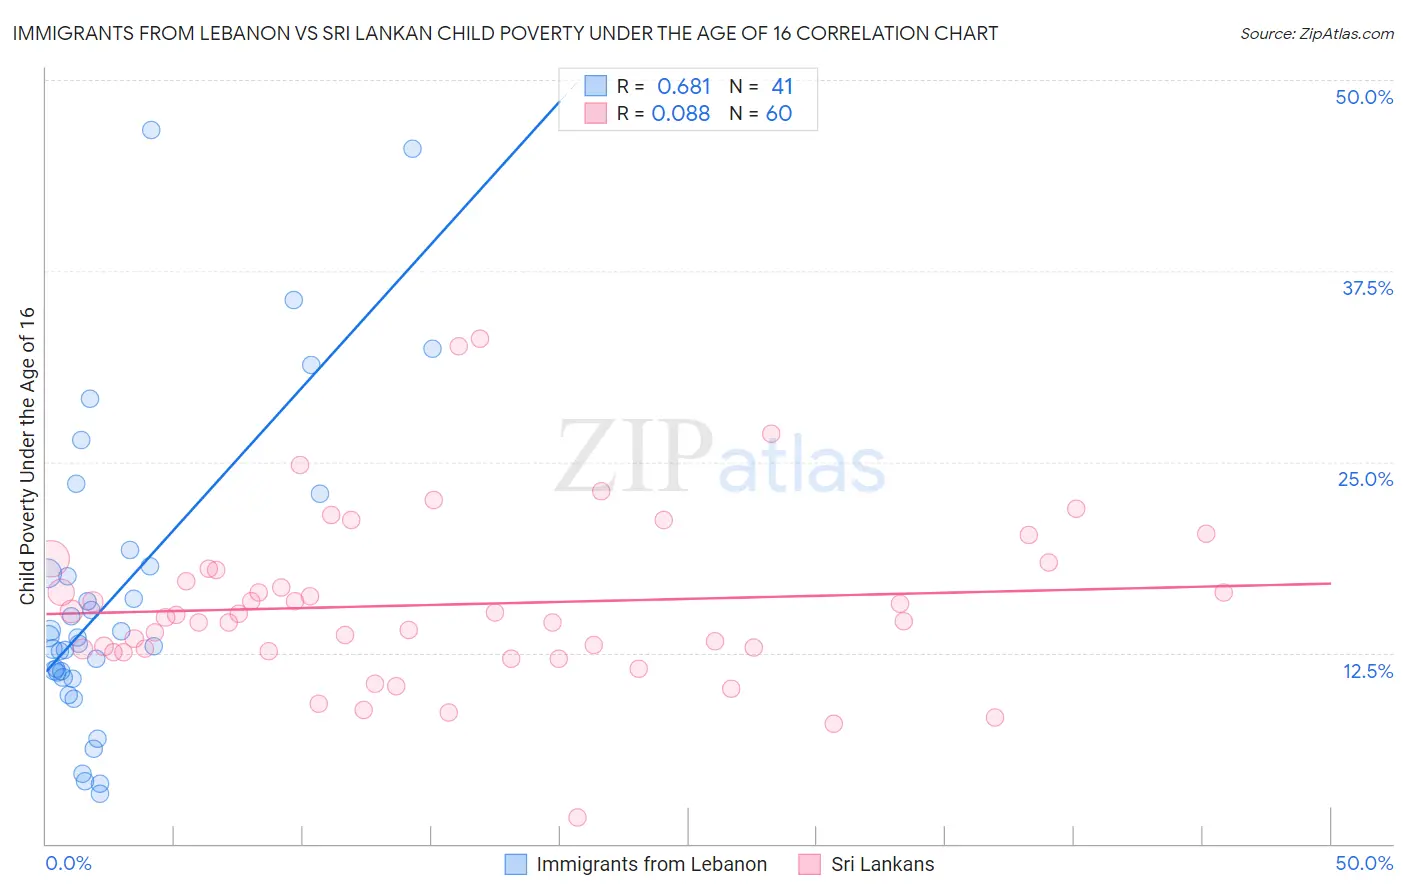
Immigrants from Lebanon vs Sri Lankan Child Poverty Under the Age of 16 Correlation Chart
The statistical analysis conducted on geographies consisting of 216,197,294 people shows a significant positive correlation between the proportion of Immigrants from Lebanon and poverty level among children under the age of 16 in the United States with a correlation coefficient (R) of 0.681 and weighted average of 16.8%. Similarly, the statistical analysis conducted on geographies consisting of 436,349,491 people shows a slight positive correlation between the proportion of Sri Lankans and poverty level among children under the age of 16 in the United States with a correlation coefficient (R) of 0.088 and weighted average of 14.9%, a difference of 12.6%.
Child Poverty Under the Age of 16 Correlation Summary
| Measurement | Immigrants from Lebanon | Sri Lankan |
| Minimum | 3.3% | 1.7% |
| Maximum | 46.8% | 33.1% |
| Range | 43.5% | 31.4% |
| Mean | 16.5% | 15.7% |
| Median | 13.5% | 14.9% |
| Interquartile 25% (IQ1) | 11.0% | 12.7% |
| Interquartile 75% (IQ3) | 18.7% | 18.0% |
| Interquartile Range (IQR) | 7.7% | 5.3% |
| Standard Deviation (Sample) | 10.2% | 5.5% |
| Standard Deviation (Population) | 10.1% | 5.5% |
Similar Demographics by Child Poverty Under the Age of 16
Demographics Similar to Immigrants from Lebanon by Child Poverty Under the Age of 16
In terms of child poverty under the age of 16, the demographic groups most similar to Immigrants from Lebanon are Immigrants from Uganda (16.8%, a difference of 0.080%), Immigrants from Uruguay (16.8%, a difference of 0.17%), Spaniard (16.8%, a difference of 0.19%), Spanish (16.7%, a difference of 0.39%), and Immigrants from Kenya (16.9%, a difference of 0.52%).
| Demographics | Rating | Rank | Child Poverty Under the Age of 16 |
| Immigrants | Portugal | 30.0 /100 | #189 | Fair 16.6% |
| Immigrants | Costa Rica | 29.6 /100 | #190 | Fair 16.6% |
| Immigrants | Iraq | 28.3 /100 | #191 | Fair 16.7% |
| Spanish | 24.5 /100 | #192 | Fair 16.7% |
| Spaniards | 23.2 /100 | #193 | Fair 16.8% |
| Immigrants | Uruguay | 23.1 /100 | #194 | Fair 16.8% |
| Immigrants | Uganda | 22.5 /100 | #195 | Fair 16.8% |
| Immigrants | Lebanon | 22.0 /100 | #196 | Fair 16.8% |
| Immigrants | Kenya | 19.1 /100 | #197 | Poor 16.9% |
| Delaware | 17.1 /100 | #198 | Poor 17.0% |
| Immigrants | Afghanistan | 15.1 /100 | #199 | Poor 17.0% |
| Immigrants | Cameroon | 14.7 /100 | #200 | Poor 17.1% |
| Immigrants | Uzbekistan | 14.7 /100 | #201 | Poor 17.1% |
| Ugandans | 14.3 /100 | #202 | Poor 17.1% |
| Immigrants | Sierra Leone | 14.2 /100 | #203 | Poor 17.1% |
Demographics Similar to Sri Lankans by Child Poverty Under the Age of 16
In terms of child poverty under the age of 16, the demographic groups most similar to Sri Lankans are Belgian (14.9%, a difference of 0.030%), Immigrants from Ukraine (14.9%, a difference of 0.060%), Irish (14.9%, a difference of 0.070%), Carpatho Rusyn (14.9%, a difference of 0.080%), and Immigrants from Denmark (14.9%, a difference of 0.13%).
| Demographics | Rating | Rank | Child Poverty Under the Age of 16 |
| Chileans | 94.4 /100 | #107 | Exceptional 14.8% |
| Jordanians | 94.2 /100 | #108 | Exceptional 14.8% |
| Tlingit-Haida | 94.1 /100 | #109 | Exceptional 14.9% |
| English | 93.5 /100 | #110 | Exceptional 14.9% |
| Immigrants | Denmark | 93.5 /100 | #111 | Exceptional 14.9% |
| Irish | 93.4 /100 | #112 | Exceptional 14.9% |
| Belgians | 93.3 /100 | #113 | Exceptional 14.9% |
| Sri Lankans | 93.2 /100 | #114 | Exceptional 14.9% |
| Immigrants | Ukraine | 93.1 /100 | #115 | Exceptional 14.9% |
| Carpatho Rusyns | 93.1 /100 | #116 | Exceptional 14.9% |
| Immigrants | Norway | 92.8 /100 | #117 | Exceptional 15.0% |
| Immigrants | Malaysia | 92.6 /100 | #118 | Exceptional 15.0% |
| Scottish | 92.3 /100 | #119 | Exceptional 15.0% |
| South Africans | 92.1 /100 | #120 | Exceptional 15.0% |
| Immigrants | Zimbabwe | 92.1 /100 | #121 | Exceptional 15.0% |