Immigrants from Lebanon vs Immigrants from Eastern Asia Child Poverty Under the Age of 16
COMPARE
Immigrants from Lebanon
Immigrants from Eastern Asia
Child Poverty Under the Age of 16
Child Poverty Under the Age of 16 Comparison
Immigrants from Lebanon
Immigrants from Eastern Asia
16.8%
CHILD POVERTY UNDER THE AGE OF 16
22.0/ 100
METRIC RATING
196th/ 347
METRIC RANK
13.1%
CHILD POVERTY UNDER THE AGE OF 16
99.8/ 100
METRIC RATING
21st/ 347
METRIC RANK
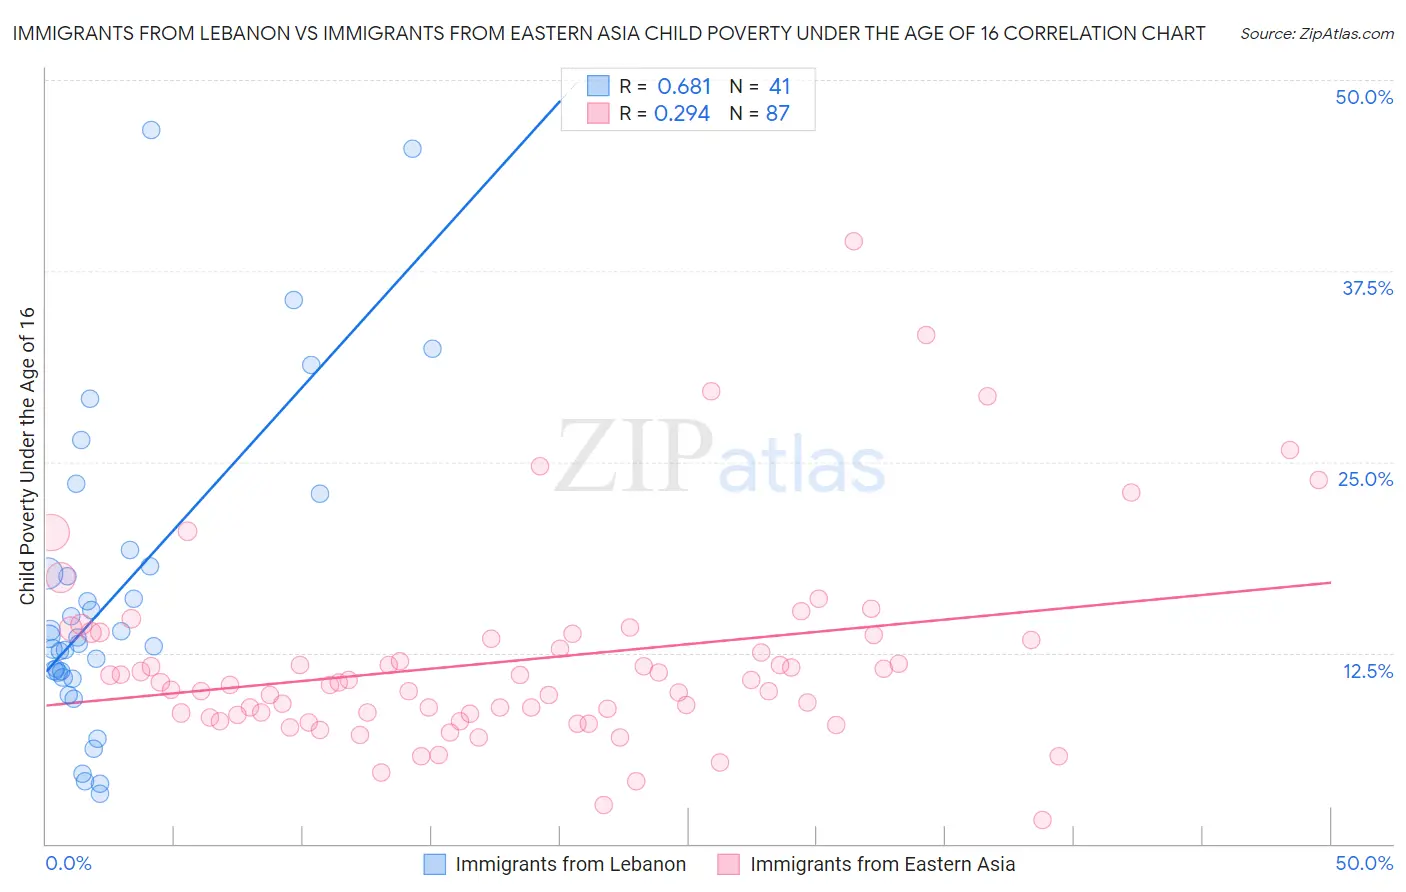
Immigrants from Lebanon vs Immigrants from Eastern Asia Child Poverty Under the Age of 16 Correlation Chart
The statistical analysis conducted on geographies consisting of 216,197,294 people shows a significant positive correlation between the proportion of Immigrants from Lebanon and poverty level among children under the age of 16 in the United States with a correlation coefficient (R) of 0.681 and weighted average of 16.8%. Similarly, the statistical analysis conducted on geographies consisting of 492,298,507 people shows a weak positive correlation between the proportion of Immigrants from Eastern Asia and poverty level among children under the age of 16 in the United States with a correlation coefficient (R) of 0.294 and weighted average of 13.1%, a difference of 28.1%.
Child Poverty Under the Age of 16 Correlation Summary
| Measurement | Immigrants from Lebanon | Immigrants from Eastern Asia |
| Minimum | 3.3% | 1.6% |
| Maximum | 46.8% | 39.5% |
| Range | 43.5% | 37.9% |
| Mean | 16.5% | 12.0% |
| Median | 13.5% | 10.6% |
| Interquartile 25% (IQ1) | 11.0% | 8.4% |
| Interquartile 75% (IQ3) | 18.7% | 13.6% |
| Interquartile Range (IQR) | 7.7% | 5.2% |
| Standard Deviation (Sample) | 10.2% | 6.5% |
| Standard Deviation (Population) | 10.1% | 6.4% |
Similar Demographics by Child Poverty Under the Age of 16
Demographics Similar to Immigrants from Lebanon by Child Poverty Under the Age of 16
In terms of child poverty under the age of 16, the demographic groups most similar to Immigrants from Lebanon are Immigrants from Uganda (16.8%, a difference of 0.080%), Immigrants from Uruguay (16.8%, a difference of 0.17%), Spaniard (16.8%, a difference of 0.19%), Spanish (16.7%, a difference of 0.39%), and Immigrants from Kenya (16.9%, a difference of 0.52%).
| Demographics | Rating | Rank | Child Poverty Under the Age of 16 |
| Immigrants | Portugal | 30.0 /100 | #189 | Fair 16.6% |
| Immigrants | Costa Rica | 29.6 /100 | #190 | Fair 16.6% |
| Immigrants | Iraq | 28.3 /100 | #191 | Fair 16.7% |
| Spanish | 24.5 /100 | #192 | Fair 16.7% |
| Spaniards | 23.2 /100 | #193 | Fair 16.8% |
| Immigrants | Uruguay | 23.1 /100 | #194 | Fair 16.8% |
| Immigrants | Uganda | 22.5 /100 | #195 | Fair 16.8% |
| Immigrants | Lebanon | 22.0 /100 | #196 | Fair 16.8% |
| Immigrants | Kenya | 19.1 /100 | #197 | Poor 16.9% |
| Delaware | 17.1 /100 | #198 | Poor 17.0% |
| Immigrants | Afghanistan | 15.1 /100 | #199 | Poor 17.0% |
| Immigrants | Cameroon | 14.7 /100 | #200 | Poor 17.1% |
| Immigrants | Uzbekistan | 14.7 /100 | #201 | Poor 17.1% |
| Ugandans | 14.3 /100 | #202 | Poor 17.1% |
| Immigrants | Sierra Leone | 14.2 /100 | #203 | Poor 17.1% |
Demographics Similar to Immigrants from Eastern Asia by Child Poverty Under the Age of 16
In terms of child poverty under the age of 16, the demographic groups most similar to Immigrants from Eastern Asia are Okinawan (13.1%, a difference of 0.030%), Maltese (13.1%, a difference of 0.080%), Indian (Asian) (13.1%, a difference of 0.12%), Latvian (13.2%, a difference of 0.33%), and Eastern European (13.2%, a difference of 0.41%).
| Demographics | Rating | Rank | Child Poverty Under the Age of 16 |
| Immigrants | Lithuania | 99.9 /100 | #14 | Exceptional 12.9% |
| Immigrants | Korea | 99.9 /100 | #15 | Exceptional 13.0% |
| Norwegians | 99.9 /100 | #16 | Exceptional 13.0% |
| Bulgarians | 99.9 /100 | #17 | Exceptional 13.0% |
| Cypriots | 99.9 /100 | #18 | Exceptional 13.0% |
| Immigrants | Japan | 99.8 /100 | #19 | Exceptional 13.0% |
| Okinawans | 99.8 /100 | #20 | Exceptional 13.1% |
| Immigrants | Eastern Asia | 99.8 /100 | #21 | Exceptional 13.1% |
| Maltese | 99.8 /100 | #22 | Exceptional 13.1% |
| Indians (Asian) | 99.8 /100 | #23 | Exceptional 13.1% |
| Latvians | 99.8 /100 | #24 | Exceptional 13.2% |
| Eastern Europeans | 99.8 /100 | #25 | Exceptional 13.2% |
| Bolivians | 99.8 /100 | #26 | Exceptional 13.2% |
| Immigrants | China | 99.8 /100 | #27 | Exceptional 13.3% |
| Assyrians/Chaldeans/Syriacs | 99.7 /100 | #28 | Exceptional 13.3% |