Immigrants from Colombia vs Immigrants from Eastern Asia Child Poverty Under the Age of 16
COMPARE
Immigrants from Colombia
Immigrants from Eastern Asia
Child Poverty Under the Age of 16
Child Poverty Under the Age of 16 Comparison
Immigrants from Colombia
Immigrants from Eastern Asia
16.1%
CHILD POVERTY UNDER THE AGE OF 16
54.4/ 100
METRIC RATING
170th/ 347
METRIC RANK
13.1%
CHILD POVERTY UNDER THE AGE OF 16
99.8/ 100
METRIC RATING
21st/ 347
METRIC RANK
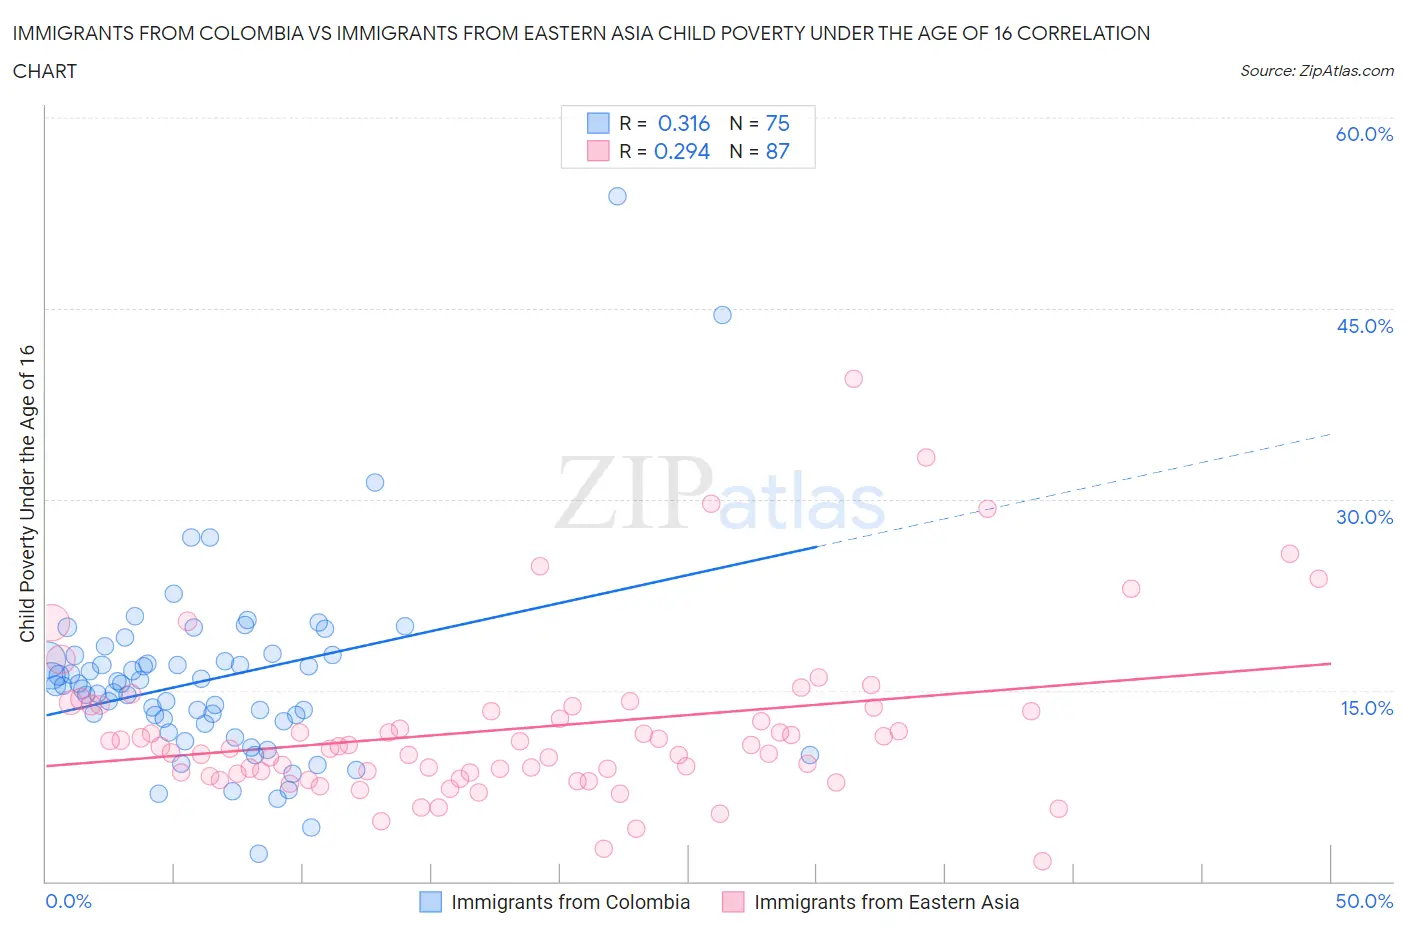
Immigrants from Colombia vs Immigrants from Eastern Asia Child Poverty Under the Age of 16 Correlation Chart
The statistical analysis conducted on geographies consisting of 375,713,281 people shows a mild positive correlation between the proportion of Immigrants from Colombia and poverty level among children under the age of 16 in the United States with a correlation coefficient (R) of 0.316 and weighted average of 16.1%. Similarly, the statistical analysis conducted on geographies consisting of 492,298,507 people shows a weak positive correlation between the proportion of Immigrants from Eastern Asia and poverty level among children under the age of 16 in the United States with a correlation coefficient (R) of 0.294 and weighted average of 13.1%, a difference of 22.8%.
Child Poverty Under the Age of 16 Correlation Summary
| Measurement | Immigrants from Colombia | Immigrants from Eastern Asia |
| Minimum | 2.1% | 1.6% |
| Maximum | 53.8% | 39.5% |
| Range | 51.7% | 37.9% |
| Mean | 15.9% | 12.0% |
| Median | 15.4% | 10.6% |
| Interquartile 25% (IQ1) | 12.5% | 8.4% |
| Interquartile 75% (IQ3) | 17.7% | 13.6% |
| Interquartile Range (IQR) | 5.2% | 5.2% |
| Standard Deviation (Sample) | 7.5% | 6.5% |
| Standard Deviation (Population) | 7.4% | 6.4% |
Similar Demographics by Child Poverty Under the Age of 16
Demographics Similar to Immigrants from Colombia by Child Poverty Under the Age of 16
In terms of child poverty under the age of 16, the demographic groups most similar to Immigrants from Colombia are Uruguayan (16.1%, a difference of 0.040%), Hungarian (16.2%, a difference of 0.23%), Afghan (16.2%, a difference of 0.26%), Immigrants from Saudi Arabia (16.2%, a difference of 0.28%), and South American (16.0%, a difference of 0.43%).
| Demographics | Rating | Rank | Child Poverty Under the Age of 16 |
| Yugoslavians | 67.6 /100 | #163 | Good 15.8% |
| Immigrants | Germany | 67.3 /100 | #164 | Good 15.8% |
| Guamanians/Chamorros | 66.4 /100 | #165 | Good 15.9% |
| Immigrants | Oceania | 65.4 /100 | #166 | Good 15.9% |
| Costa Ricans | 61.1 /100 | #167 | Good 16.0% |
| South Americans | 57.9 /100 | #168 | Average 16.0% |
| Uruguayans | 54.7 /100 | #169 | Average 16.1% |
| Immigrants | Colombia | 54.4 /100 | #170 | Average 16.1% |
| Hungarians | 52.5 /100 | #171 | Average 16.2% |
| Afghans | 52.3 /100 | #172 | Average 16.2% |
| Immigrants | Saudi Arabia | 52.1 /100 | #173 | Average 16.2% |
| Whites/Caucasians | 50.0 /100 | #174 | Average 16.2% |
| Scotch-Irish | 47.1 /100 | #175 | Average 16.3% |
| Lebanese | 45.9 /100 | #176 | Average 16.3% |
| Ethiopians | 43.4 /100 | #177 | Average 16.3% |
Demographics Similar to Immigrants from Eastern Asia by Child Poverty Under the Age of 16
In terms of child poverty under the age of 16, the demographic groups most similar to Immigrants from Eastern Asia are Okinawan (13.1%, a difference of 0.030%), Maltese (13.1%, a difference of 0.080%), Indian (Asian) (13.1%, a difference of 0.12%), Latvian (13.2%, a difference of 0.33%), and Eastern European (13.2%, a difference of 0.41%).
| Demographics | Rating | Rank | Child Poverty Under the Age of 16 |
| Immigrants | Lithuania | 99.9 /100 | #14 | Exceptional 12.9% |
| Immigrants | Korea | 99.9 /100 | #15 | Exceptional 13.0% |
| Norwegians | 99.9 /100 | #16 | Exceptional 13.0% |
| Bulgarians | 99.9 /100 | #17 | Exceptional 13.0% |
| Cypriots | 99.9 /100 | #18 | Exceptional 13.0% |
| Immigrants | Japan | 99.8 /100 | #19 | Exceptional 13.0% |
| Okinawans | 99.8 /100 | #20 | Exceptional 13.1% |
| Immigrants | Eastern Asia | 99.8 /100 | #21 | Exceptional 13.1% |
| Maltese | 99.8 /100 | #22 | Exceptional 13.1% |
| Indians (Asian) | 99.8 /100 | #23 | Exceptional 13.1% |
| Latvians | 99.8 /100 | #24 | Exceptional 13.2% |
| Eastern Europeans | 99.8 /100 | #25 | Exceptional 13.2% |
| Bolivians | 99.8 /100 | #26 | Exceptional 13.2% |
| Immigrants | China | 99.8 /100 | #27 | Exceptional 13.3% |
| Assyrians/Chaldeans/Syriacs | 99.7 /100 | #28 | Exceptional 13.3% |