Immigrants from Latin America vs Immigrants from Panama Family Poverty
COMPARE
Immigrants from Latin America
Immigrants from Panama
Family Poverty
Family Poverty Comparison
Immigrants from Latin America
Immigrants from Panama
11.8%
FAMILY POVERTY
0.0/ 100
METRIC RATING
304th/ 347
METRIC RANK
10.0%
FAMILY POVERTY
3.1/ 100
METRIC RATING
230th/ 347
METRIC RANK
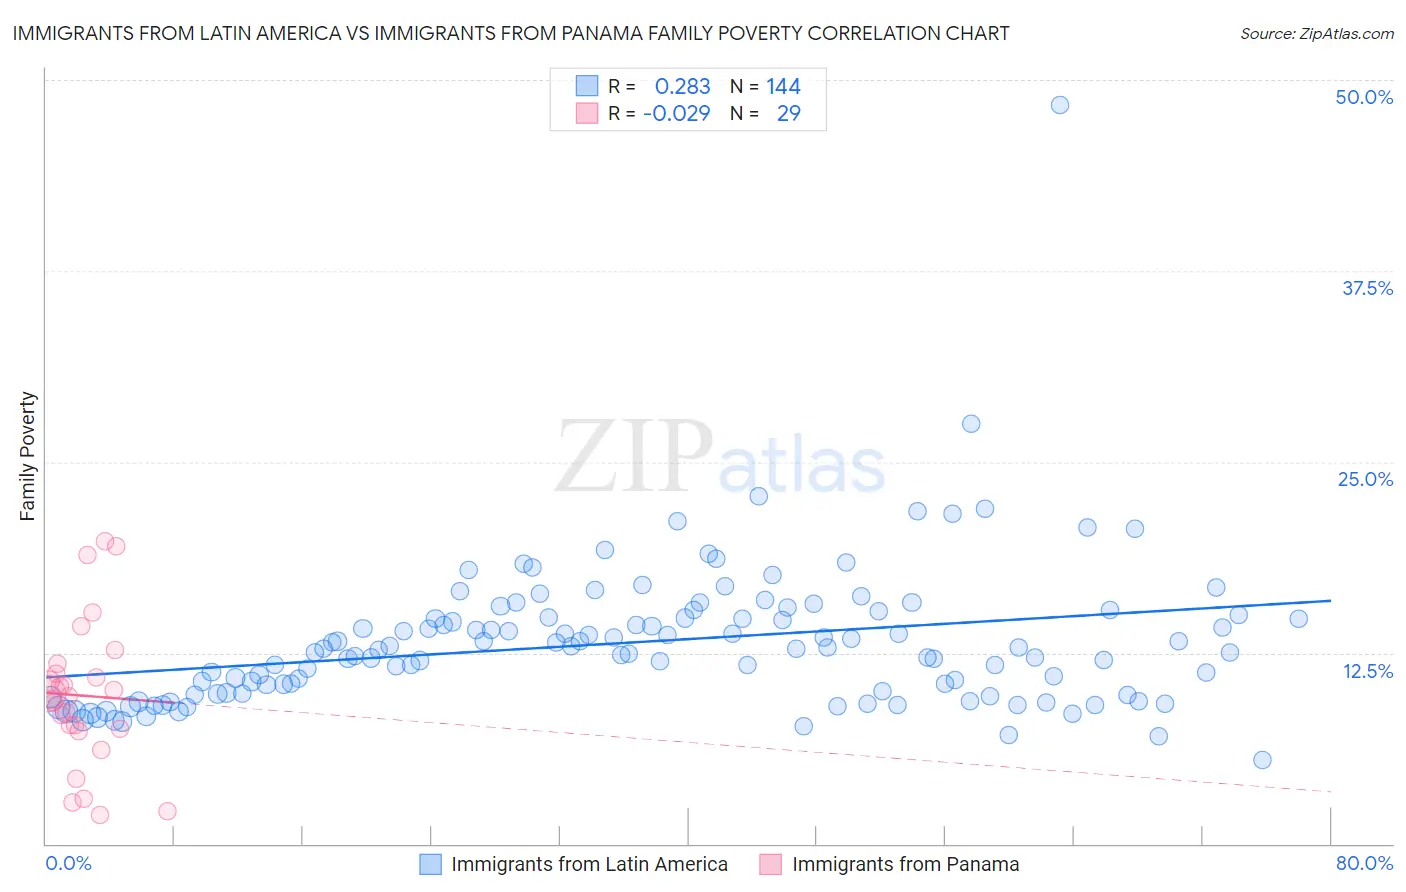
Immigrants from Latin America vs Immigrants from Panama Family Poverty Correlation Chart
The statistical analysis conducted on geographies consisting of 554,872,289 people shows a weak positive correlation between the proportion of Immigrants from Latin America and poverty level among families in the United States with a correlation coefficient (R) of 0.283 and weighted average of 11.8%. Similarly, the statistical analysis conducted on geographies consisting of 220,994,048 people shows no correlation between the proportion of Immigrants from Panama and poverty level among families in the United States with a correlation coefficient (R) of -0.029 and weighted average of 10.0%, a difference of 17.7%.
Family Poverty Correlation Summary
| Measurement | Immigrants from Latin America | Immigrants from Panama |
| Minimum | 5.5% | 1.9% |
| Maximum | 48.4% | 19.8% |
| Range | 42.9% | 17.9% |
| Mean | 13.2% | 9.7% |
| Median | 12.7% | 9.7% |
| Interquartile 25% (IQ1) | 9.8% | 7.4% |
| Interquartile 75% (IQ3) | 14.8% | 11.5% |
| Interquartile Range (IQR) | 5.0% | 4.0% |
| Standard Deviation (Sample) | 4.7% | 4.7% |
| Standard Deviation (Population) | 4.7% | 4.6% |
Similar Demographics by Family Poverty
Demographics Similar to Immigrants from Latin America by Family Poverty
In terms of family poverty, the demographic groups most similar to Immigrants from Latin America are Mexican (11.8%, a difference of 0.18%), African (11.8%, a difference of 0.19%), Guatemalan (11.7%, a difference of 0.69%), Bahamian (11.7%, a difference of 0.73%), and Cajun (11.9%, a difference of 0.74%).
| Demographics | Rating | Rank | Family Poverty |
| Creek | 0.0 /100 | #297 | Tragic 11.7% |
| Immigrants | Senegal | 0.0 /100 | #298 | Tragic 11.7% |
| Dutch West Indians | 0.0 /100 | #299 | Tragic 11.7% |
| Immigrants | Bangladesh | 0.0 /100 | #300 | Tragic 11.7% |
| Bahamians | 0.0 /100 | #301 | Tragic 11.7% |
| Guatemalans | 0.0 /100 | #302 | Tragic 11.7% |
| Africans | 0.0 /100 | #303 | Tragic 11.8% |
| Immigrants | Latin America | 0.0 /100 | #304 | Tragic 11.8% |
| Mexicans | 0.0 /100 | #305 | Tragic 11.8% |
| Cajuns | 0.0 /100 | #306 | Tragic 11.9% |
| Immigrants | Congo | 0.0 /100 | #307 | Tragic 11.9% |
| Seminole | 0.0 /100 | #308 | Tragic 11.9% |
| Hispanics or Latinos | 0.0 /100 | #309 | Tragic 12.0% |
| Immigrants | Guatemala | 0.0 /100 | #310 | Tragic 12.0% |
| Ute | 0.0 /100 | #311 | Tragic 12.1% |
Demographics Similar to Immigrants from Panama by Family Poverty
In terms of family poverty, the demographic groups most similar to Immigrants from Panama are Immigrants from Uzbekistan (10.0%, a difference of 0.020%), Sudanese (10.0%, a difference of 0.030%), Immigrants from Armenia (10.0%, a difference of 0.23%), Ottawa (10.0%, a difference of 0.25%), and Alaskan Athabascan (10.1%, a difference of 0.38%).
| Demographics | Rating | Rank | Family Poverty |
| Immigrants | Africa | 4.3 /100 | #223 | Tragic 9.9% |
| Marshallese | 3.9 /100 | #224 | Tragic 9.9% |
| Immigrants | Immigrants | 3.6 /100 | #225 | Tragic 10.0% |
| Ottawa | 3.3 /100 | #226 | Tragic 10.0% |
| Immigrants | Armenia | 3.3 /100 | #227 | Tragic 10.0% |
| Sudanese | 3.1 /100 | #228 | Tragic 10.0% |
| Immigrants | Uzbekistan | 3.1 /100 | #229 | Tragic 10.0% |
| Immigrants | Panama | 3.1 /100 | #230 | Tragic 10.0% |
| Alaskan Athabascans | 2.7 /100 | #231 | Tragic 10.1% |
| Immigrants | Sudan | 2.3 /100 | #232 | Tragic 10.1% |
| Fijians | 2.1 /100 | #233 | Tragic 10.1% |
| Immigrants | Middle Africa | 2.1 /100 | #234 | Tragic 10.1% |
| Nigerians | 2.0 /100 | #235 | Tragic 10.1% |
| Immigrants | Nigeria | 1.9 /100 | #236 | Tragic 10.2% |
| Immigrants | Laos | 1.7 /100 | #237 | Tragic 10.2% |