Immigrants from Laos vs Immigrants from Southern Europe Single Female Poverty
COMPARE
Immigrants from Laos
Immigrants from Southern Europe
Single Female Poverty
Single Female Poverty Comparison
Immigrants from Laos
Immigrants from Southern Europe
22.9%
SINGLE FEMALE POVERTY
0.3/ 100
METRIC RATING
264th/ 347
METRIC RANK
19.9%
SINGLE FEMALE POVERTY
97.1/ 100
METRIC RATING
103rd/ 347
METRIC RANK
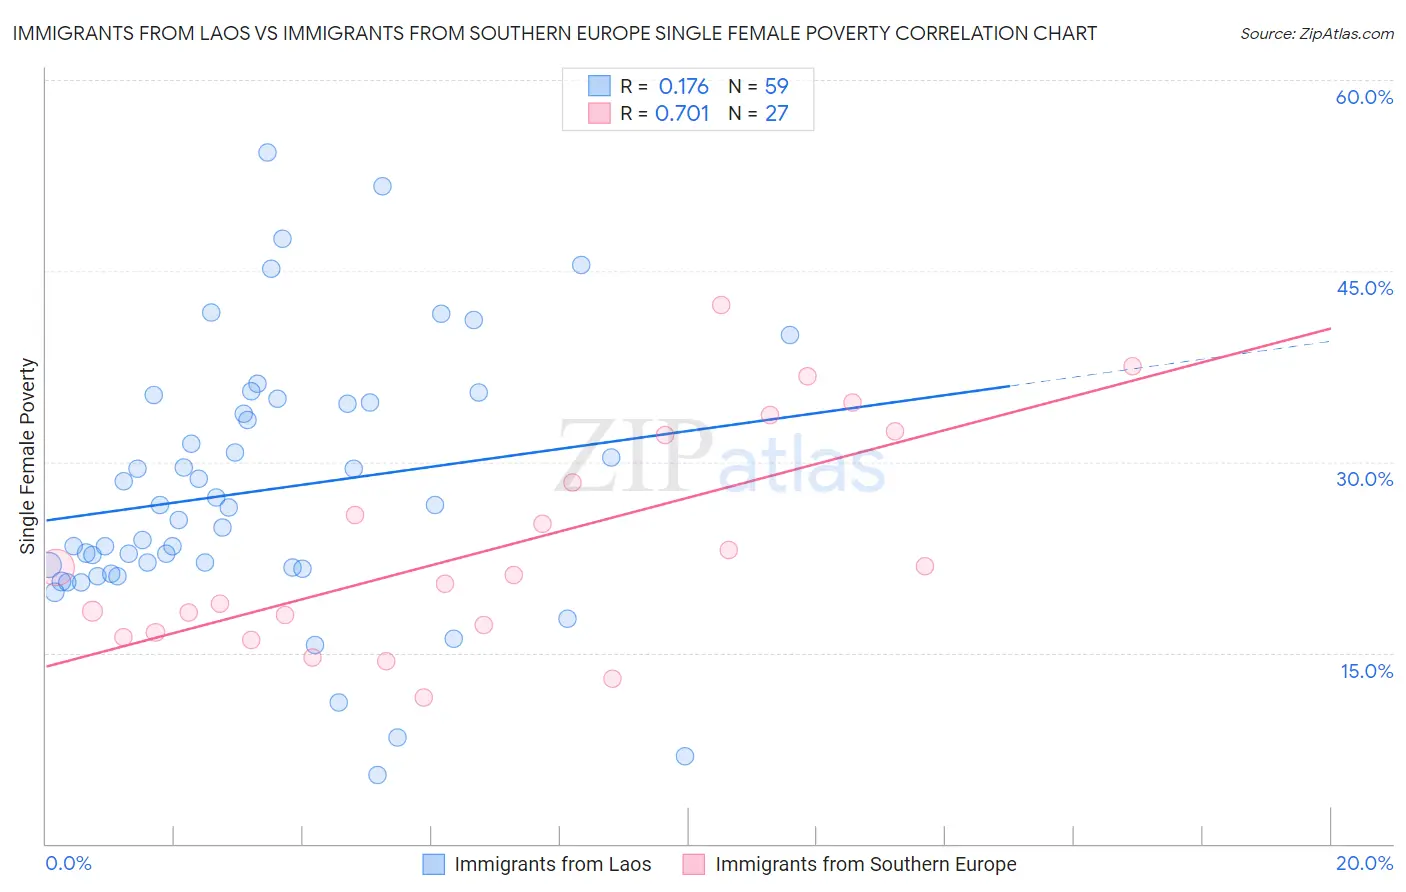
Immigrants from Laos vs Immigrants from Southern Europe Single Female Poverty Correlation Chart
The statistical analysis conducted on geographies consisting of 200,096,236 people shows a poor positive correlation between the proportion of Immigrants from Laos and poverty level among single females in the United States with a correlation coefficient (R) of 0.176 and weighted average of 22.9%. Similarly, the statistical analysis conducted on geographies consisting of 394,858,159 people shows a strong positive correlation between the proportion of Immigrants from Southern Europe and poverty level among single females in the United States with a correlation coefficient (R) of 0.701 and weighted average of 19.9%, a difference of 15.5%.
Single Female Poverty Correlation Summary
| Measurement | Immigrants from Laos | Immigrants from Southern Europe |
| Minimum | 5.4% | 11.5% |
| Maximum | 54.3% | 42.3% |
| Range | 48.9% | 30.8% |
| Mean | 27.8% | 23.3% |
| Median | 26.4% | 21.1% |
| Interquartile 25% (IQ1) | 21.6% | 16.6% |
| Interquartile 75% (IQ3) | 34.7% | 32.1% |
| Interquartile Range (IQR) | 13.1% | 15.5% |
| Standard Deviation (Sample) | 10.3% | 8.5% |
| Standard Deviation (Population) | 10.2% | 8.3% |
Similar Demographics by Single Female Poverty
Demographics Similar to Immigrants from Laos by Single Female Poverty
In terms of single female poverty, the demographic groups most similar to Immigrants from Laos are Scotch-Irish (22.9%, a difference of 0.070%), Central American (23.0%, a difference of 0.17%), Immigrants from Micronesia (23.0%, a difference of 0.38%), Senegalese (23.0%, a difference of 0.44%), and British West Indian (22.8%, a difference of 0.48%).
| Demographics | Rating | Rank | Single Female Poverty |
| Sudanese | 0.7 /100 | #257 | Tragic 22.6% |
| Bahamians | 0.6 /100 | #258 | Tragic 22.7% |
| Whites/Caucasians | 0.6 /100 | #259 | Tragic 22.7% |
| Celtics | 0.5 /100 | #260 | Tragic 22.7% |
| Immigrants | Cabo Verde | 0.4 /100 | #261 | Tragic 22.8% |
| British West Indians | 0.4 /100 | #262 | Tragic 22.8% |
| Scotch-Irish | 0.3 /100 | #263 | Tragic 22.9% |
| Immigrants | Laos | 0.3 /100 | #264 | Tragic 22.9% |
| Central Americans | 0.2 /100 | #265 | Tragic 23.0% |
| Immigrants | Micronesia | 0.2 /100 | #266 | Tragic 23.0% |
| Senegalese | 0.2 /100 | #267 | Tragic 23.0% |
| Fijians | 0.2 /100 | #268 | Tragic 23.1% |
| Hmong | 0.2 /100 | #269 | Tragic 23.1% |
| Inupiat | 0.2 /100 | #270 | Tragic 23.1% |
| Sub-Saharan Africans | 0.1 /100 | #271 | Tragic 23.2% |
Demographics Similar to Immigrants from Southern Europe by Single Female Poverty
In terms of single female poverty, the demographic groups most similar to Immigrants from Southern Europe are Immigrants from Cameroon (19.8%, a difference of 0.12%), Chilean (19.9%, a difference of 0.12%), Immigrants from Belgium (19.8%, a difference of 0.13%), Israeli (19.9%, a difference of 0.13%), and Ethiopian (19.9%, a difference of 0.22%).
| Demographics | Rating | Rank | Single Female Poverty |
| Immigrants | Brazil | 98.2 /100 | #96 | Exceptional 19.7% |
| Croatians | 98.1 /100 | #97 | Exceptional 19.7% |
| Immigrants | France | 97.9 /100 | #98 | Exceptional 19.7% |
| Sierra Leoneans | 97.9 /100 | #99 | Exceptional 19.7% |
| Ukrainians | 97.6 /100 | #100 | Exceptional 19.8% |
| Immigrants | Belgium | 97.3 /100 | #101 | Exceptional 19.8% |
| Immigrants | Cameroon | 97.3 /100 | #102 | Exceptional 19.8% |
| Immigrants | Southern Europe | 97.1 /100 | #103 | Exceptional 19.9% |
| Chileans | 96.9 /100 | #104 | Exceptional 19.9% |
| Israelis | 96.9 /100 | #105 | Exceptional 19.9% |
| Ethiopians | 96.7 /100 | #106 | Exceptional 19.9% |
| Immigrants | Syria | 96.7 /100 | #107 | Exceptional 19.9% |
| Native Hawaiians | 96.6 /100 | #108 | Exceptional 19.9% |
| Colombians | 96.6 /100 | #109 | Exceptional 19.9% |
| Immigrants | Western Asia | 96.5 /100 | #110 | Exceptional 19.9% |