Immigrants from Korea vs Immigrants from Peru Single Mother Poverty
COMPARE
Immigrants from Korea
Immigrants from Peru
Single Mother Poverty
Single Mother Poverty Comparison
Immigrants from Korea
Immigrants from Peru
26.2%
SINGLE MOTHER POVERTY
100.0/ 100
METRIC RATING
22nd/ 347
METRIC RANK
27.5%
SINGLE MOTHER POVERTY
99.2/ 100
METRIC RATING
77th/ 347
METRIC RANK
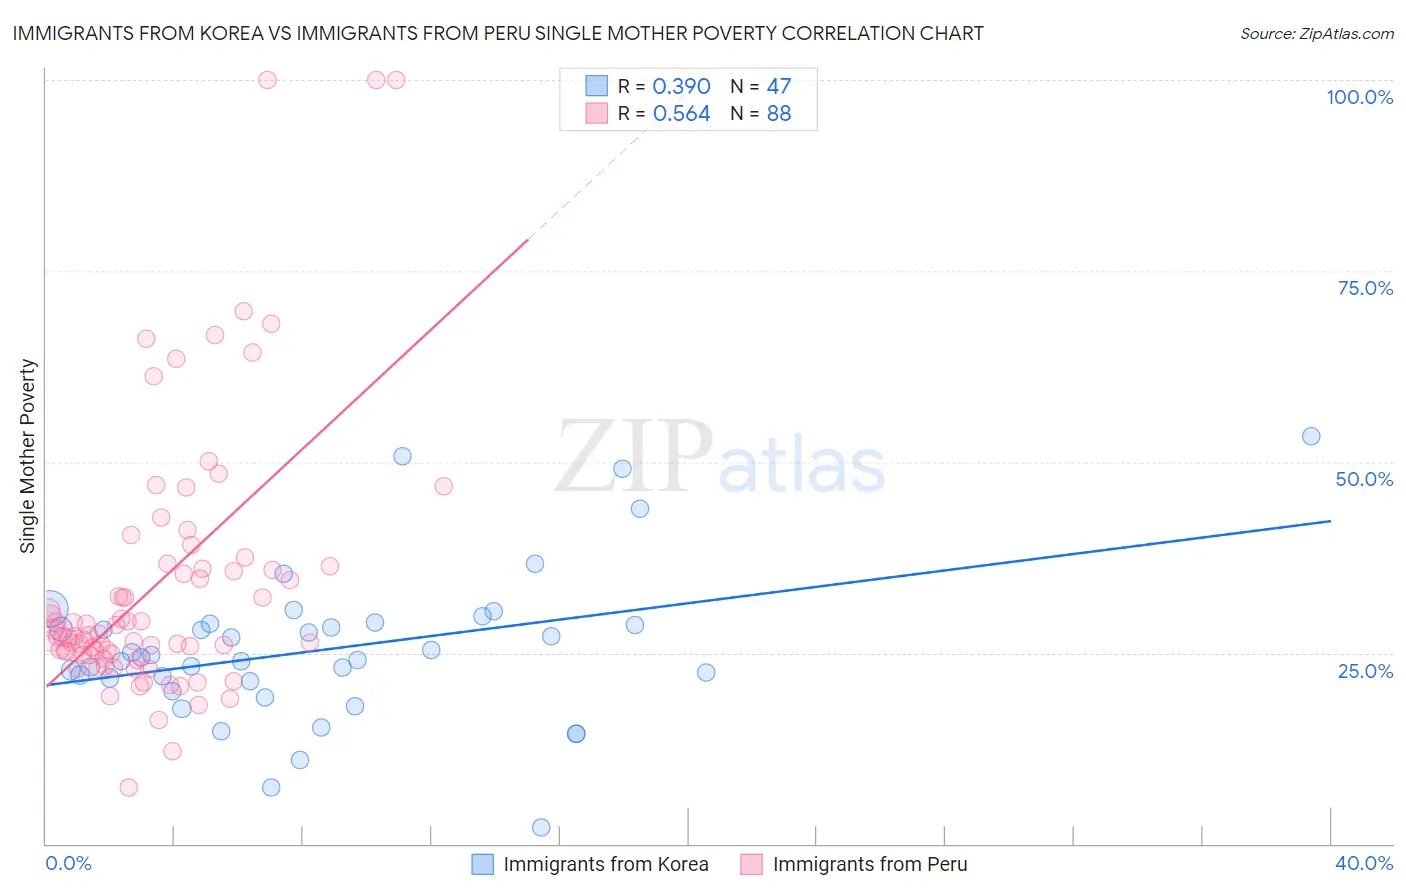
Immigrants from Korea vs Immigrants from Peru Single Mother Poverty Correlation Chart
The statistical analysis conducted on geographies consisting of 404,112,179 people shows a mild positive correlation between the proportion of Immigrants from Korea and poverty level among single mothers in the United States with a correlation coefficient (R) of 0.390 and weighted average of 26.2%. Similarly, the statistical analysis conducted on geographies consisting of 322,796,493 people shows a substantial positive correlation between the proportion of Immigrants from Peru and poverty level among single mothers in the United States with a correlation coefficient (R) of 0.564 and weighted average of 27.5%, a difference of 5.0%.
Single Mother Poverty Correlation Summary
| Measurement | Immigrants from Korea | Immigrants from Peru |
| Minimum | 2.1% | 7.3% |
| Maximum | 53.3% | 100.0% |
| Range | 51.2% | 92.7% |
| Mean | 25.5% | 34.0% |
| Median | 24.4% | 27.2% |
| Interquartile 25% (IQ1) | 21.2% | 24.8% |
| Interquartile 75% (IQ3) | 28.8% | 36.2% |
| Interquartile Range (IQR) | 7.5% | 11.4% |
| Standard Deviation (Sample) | 9.9% | 17.7% |
| Standard Deviation (Population) | 9.8% | 17.6% |
Similar Demographics by Single Mother Poverty
Demographics Similar to Immigrants from Korea by Single Mother Poverty
In terms of single mother poverty, the demographic groups most similar to Immigrants from Korea are Immigrants from Bolivia (26.2%, a difference of 0.17%), Burmese (26.2%, a difference of 0.17%), Immigrants from Moldova (26.2%, a difference of 0.20%), Immigrants from China (26.1%, a difference of 0.36%), and Immigrants from Asia (26.3%, a difference of 0.39%).
| Demographics | Rating | Rank | Single Mother Poverty |
| Immigrants | Ireland | 100.0 /100 | #15 | Exceptional 25.8% |
| Bolivians | 100.0 /100 | #16 | Exceptional 25.9% |
| Asians | 100.0 /100 | #17 | Exceptional 26.0% |
| Immigrants | Pakistan | 100.0 /100 | #18 | Exceptional 26.0% |
| Immigrants | Eastern Asia | 100.0 /100 | #19 | Exceptional 26.1% |
| Immigrants | China | 100.0 /100 | #20 | Exceptional 26.1% |
| Immigrants | Bolivia | 100.0 /100 | #21 | Exceptional 26.2% |
| Immigrants | Korea | 100.0 /100 | #22 | Exceptional 26.2% |
| Burmese | 100.0 /100 | #23 | Exceptional 26.2% |
| Immigrants | Moldova | 100.0 /100 | #24 | Exceptional 26.2% |
| Immigrants | Asia | 100.0 /100 | #25 | Exceptional 26.3% |
| Immigrants | Sri Lanka | 100.0 /100 | #26 | Exceptional 26.3% |
| Immigrants | Japan | 100.0 /100 | #27 | Exceptional 26.4% |
| Koreans | 100.0 /100 | #28 | Exceptional 26.4% |
| Jordanians | 100.0 /100 | #29 | Exceptional 26.4% |
Demographics Similar to Immigrants from Peru by Single Mother Poverty
In terms of single mother poverty, the demographic groups most similar to Immigrants from Peru are Immigrants from North Macedonia (27.5%, a difference of 0.010%), Peruvian (27.5%, a difference of 0.020%), Immigrants from Italy (27.5%, a difference of 0.050%), Taiwanese (27.5%, a difference of 0.050%), and Immigrants from Sweden (27.5%, a difference of 0.060%).
| Demographics | Rating | Rank | Single Mother Poverty |
| Immigrants | Belarus | 99.4 /100 | #70 | Exceptional 27.4% |
| Macedonians | 99.4 /100 | #71 | Exceptional 27.4% |
| Immigrants | Russia | 99.4 /100 | #72 | Exceptional 27.4% |
| Sierra Leoneans | 99.3 /100 | #73 | Exceptional 27.4% |
| Immigrants | Europe | 99.3 /100 | #74 | Exceptional 27.4% |
| Immigrants | Sweden | 99.2 /100 | #75 | Exceptional 27.5% |
| Peruvians | 99.2 /100 | #76 | Exceptional 27.5% |
| Immigrants | Peru | 99.2 /100 | #77 | Exceptional 27.5% |
| Immigrants | North Macedonia | 99.2 /100 | #78 | Exceptional 27.5% |
| Immigrants | Italy | 99.1 /100 | #79 | Exceptional 27.5% |
| Taiwanese | 99.1 /100 | #80 | Exceptional 27.5% |
| Immigrants | Scotland | 98.9 /100 | #81 | Exceptional 27.6% |
| Immigrants | Cameroon | 98.8 /100 | #82 | Exceptional 27.6% |
| Greeks | 98.7 /100 | #83 | Exceptional 27.7% |
| Immigrants | Latvia | 98.7 /100 | #84 | Exceptional 27.7% |