Immigrants from Kazakhstan vs Hispanic or Latino Seniors Poverty Over the Age of 65
COMPARE
Immigrants from Kazakhstan
Hispanic or Latino
Seniors Poverty Over the Age of 65
Seniors Poverty Over the Age of 65 Comparison
Immigrants from Kazakhstan
Hispanics or Latinos
11.0%
SENIORS POVERTY OVER THE AGE OF 65
41.0/ 100
METRIC RATING
183rd/ 347
METRIC RANK
14.3%
SENIORS POVERTY OVER THE AGE OF 65
0.0/ 100
METRIC RATING
312th/ 347
METRIC RANK
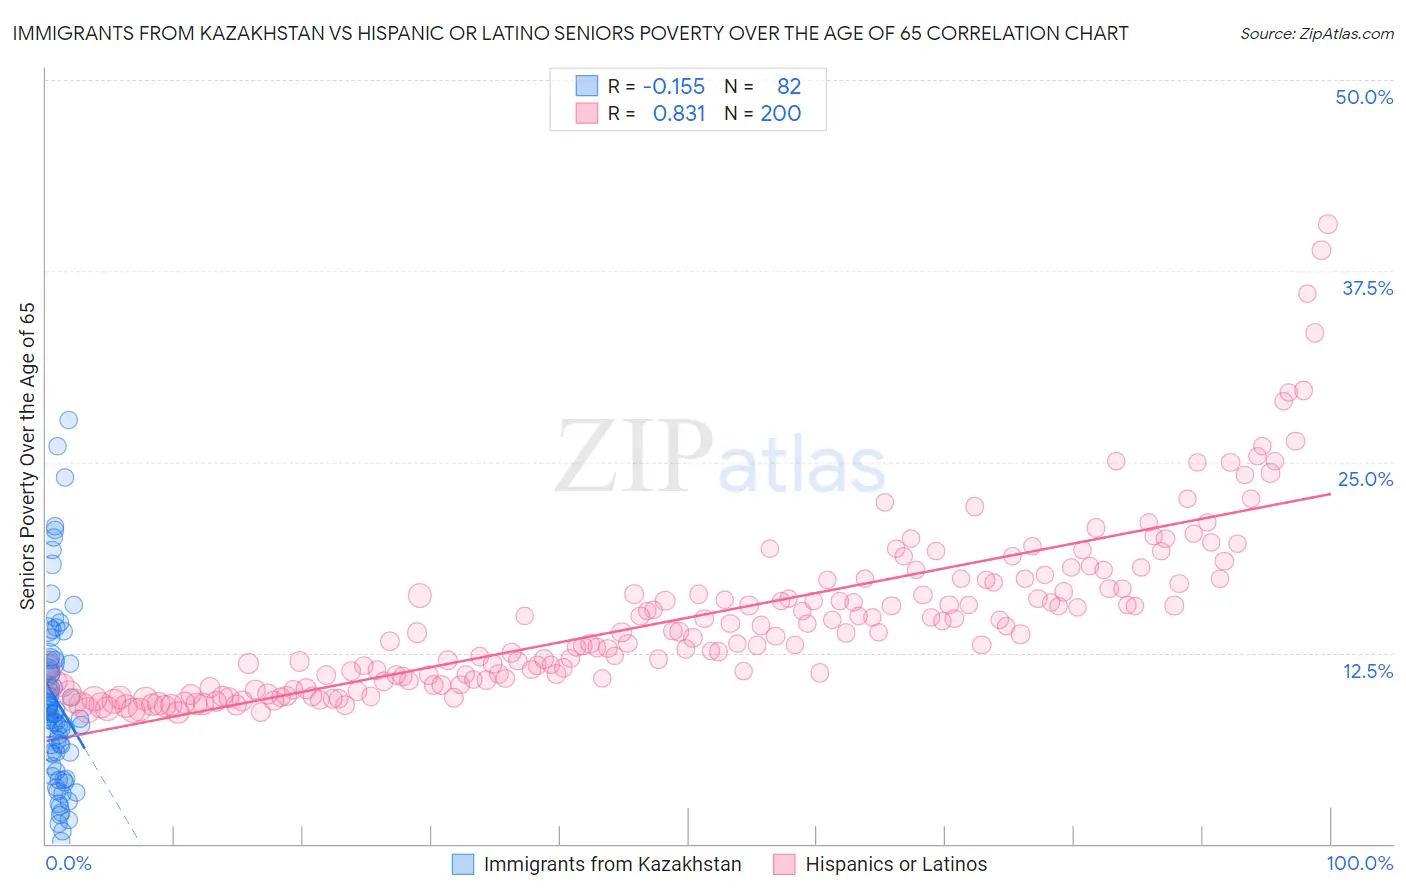
Immigrants from Kazakhstan vs Hispanic or Latino Seniors Poverty Over the Age of 65 Correlation Chart
The statistical analysis conducted on geographies consisting of 124,275,071 people shows a poor negative correlation between the proportion of Immigrants from Kazakhstan and poverty level among seniors over the age of 65 in the United States with a correlation coefficient (R) of -0.155 and weighted average of 11.0%. Similarly, the statistical analysis conducted on geographies consisting of 572,245,774 people shows a very strong positive correlation between the proportion of Hispanics or Latinos and poverty level among seniors over the age of 65 in the United States with a correlation coefficient (R) of 0.831 and weighted average of 14.3%, a difference of 29.8%.
Seniors Poverty Over the Age of 65 Correlation Summary
| Measurement | Immigrants from Kazakhstan | Hispanic or Latino |
| Minimum | 0.18% | 8.6% |
| Maximum | 27.8% | 40.6% |
| Range | 27.6% | 32.0% |
| Mean | 9.3% | 14.8% |
| Median | 8.5% | 13.8% |
| Interquartile 25% (IQ1) | 5.9% | 10.7% |
| Interquartile 75% (IQ3) | 11.9% | 17.2% |
| Interquartile Range (IQR) | 6.0% | 6.5% |
| Standard Deviation (Sample) | 5.7% | 5.6% |
| Standard Deviation (Population) | 5.7% | 5.6% |
Similar Demographics by Seniors Poverty Over the Age of 65
Demographics Similar to Immigrants from Kazakhstan by Seniors Poverty Over the Age of 65
In terms of seniors poverty over the age of 65, the demographic groups most similar to Immigrants from Kazakhstan are Immigrants from France (11.0%, a difference of 0.010%), Immigrants from Fiji (11.0%, a difference of 0.090%), Immigrants from Eastern Africa (11.0%, a difference of 0.22%), Immigrants from Thailand (11.0%, a difference of 0.23%), and Immigrants from Lebanon (11.1%, a difference of 0.25%).
| Demographics | Rating | Rank | Seniors Poverty Over the Age of 65 |
| Immigrants | Malaysia | 47.9 /100 | #176 | Average 11.0% |
| Cherokee | 47.3 /100 | #177 | Average 11.0% |
| German Russians | 46.9 /100 | #178 | Average 11.0% |
| Immigrants | Northern Africa | 44.6 /100 | #179 | Average 11.0% |
| Immigrants | Thailand | 43.5 /100 | #180 | Average 11.0% |
| Immigrants | Eastern Africa | 43.4 /100 | #181 | Average 11.0% |
| Immigrants | Fiji | 42.0 /100 | #182 | Average 11.0% |
| Immigrants | Kazakhstan | 41.0 /100 | #183 | Average 11.0% |
| Immigrants | France | 40.9 /100 | #184 | Average 11.0% |
| Immigrants | Lebanon | 38.2 /100 | #185 | Fair 11.1% |
| Immigrants | Eastern Asia | 37.5 /100 | #186 | Fair 11.1% |
| Immigrants | Middle Africa | 37.4 /100 | #187 | Fair 11.1% |
| Immigrants | Hong Kong | 36.3 /100 | #188 | Fair 11.1% |
| Immigrants | Laos | 35.7 /100 | #189 | Fair 11.1% |
| Indians (Asian) | 34.2 /100 | #190 | Fair 11.1% |
Demographics Similar to Hispanics or Latinos by Seniors Poverty Over the Age of 65
In terms of seniors poverty over the age of 65, the demographic groups most similar to Hispanics or Latinos are Barbadian (14.4%, a difference of 0.37%), Bahamian (14.2%, a difference of 0.54%), Native/Alaskan (14.2%, a difference of 0.54%), Guyanese (14.4%, a difference of 0.77%), and Honduran (14.2%, a difference of 0.80%).
| Demographics | Rating | Rank | Seniors Poverty Over the Age of 65 |
| Immigrants | Trinidad and Tobago | 0.0 /100 | #305 | Tragic 14.1% |
| Immigrants | Latin America | 0.0 /100 | #306 | Tragic 14.2% |
| Immigrants | West Indies | 0.0 /100 | #307 | Tragic 14.2% |
| Trinidadians and Tobagonians | 0.0 /100 | #308 | Tragic 14.2% |
| Hondurans | 0.0 /100 | #309 | Tragic 14.2% |
| Bahamians | 0.0 /100 | #310 | Tragic 14.2% |
| Natives/Alaskans | 0.0 /100 | #311 | Tragic 14.2% |
| Hispanics or Latinos | 0.0 /100 | #312 | Tragic 14.3% |
| Barbadians | 0.0 /100 | #313 | Tragic 14.4% |
| Guyanese | 0.0 /100 | #314 | Tragic 14.4% |
| Immigrants | Ecuador | 0.0 /100 | #315 | Tragic 14.4% |
| Immigrants | Guyana | 0.0 /100 | #316 | Tragic 14.5% |
| Haitians | 0.0 /100 | #317 | Tragic 14.5% |
| Immigrants | Honduras | 0.0 /100 | #318 | Tragic 14.5% |
| Cape Verdeans | 0.0 /100 | #319 | Tragic 14.7% |