British West Indian vs Hispanic or Latino Seniors Poverty Over the Age of 65
COMPARE
British West Indian
Hispanic or Latino
Seniors Poverty Over the Age of 65
Seniors Poverty Over the Age of 65 Comparison
British West Indians
Hispanics or Latinos
15.6%
SENIORS POVERTY OVER THE AGE OF 65
0.0/ 100
METRIC RATING
331st/ 347
METRIC RANK
14.3%
SENIORS POVERTY OVER THE AGE OF 65
0.0/ 100
METRIC RATING
312th/ 347
METRIC RANK
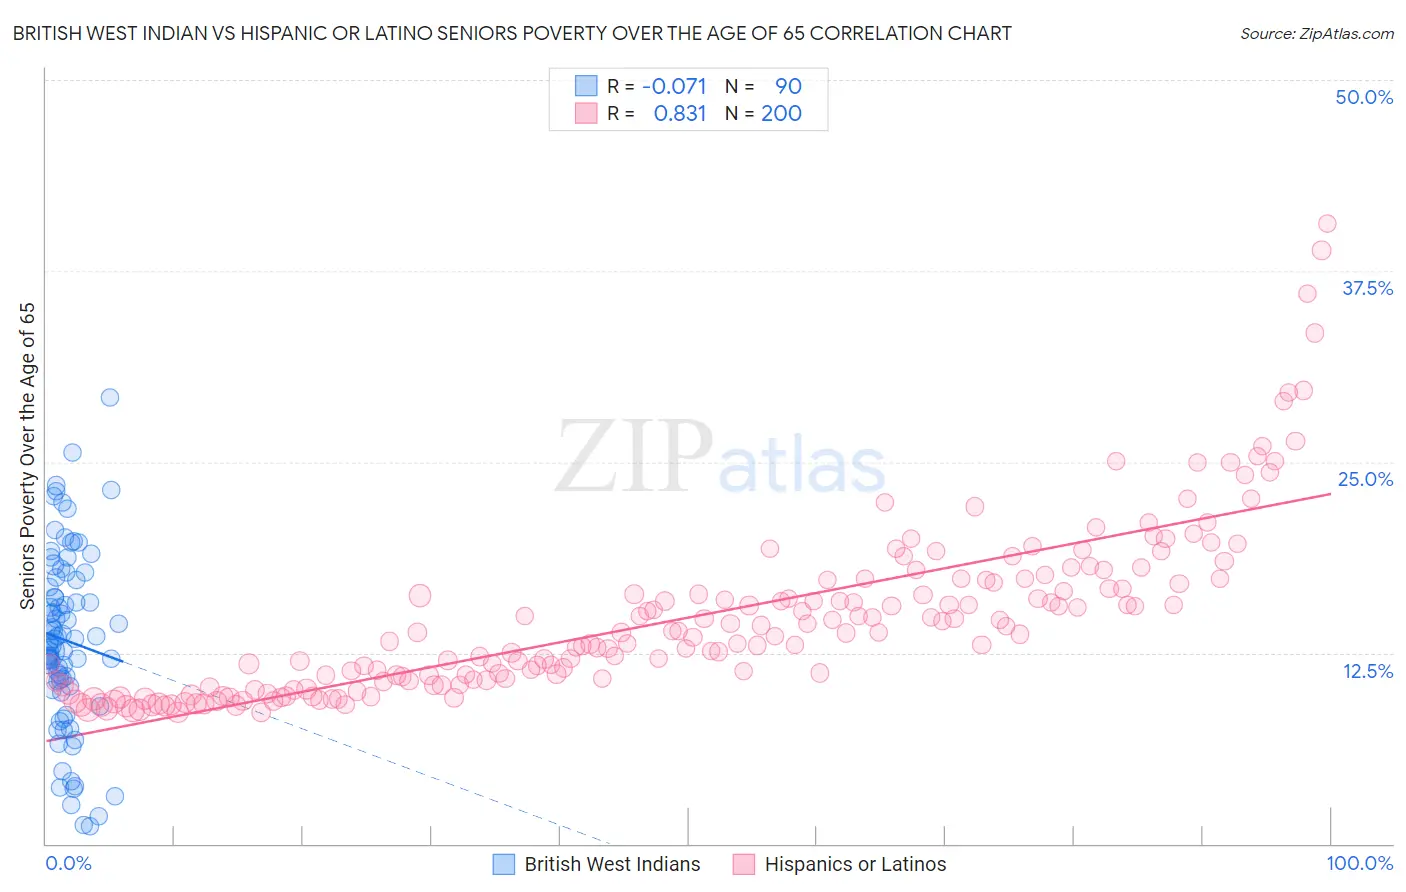
British West Indian vs Hispanic or Latino Seniors Poverty Over the Age of 65 Correlation Chart
The statistical analysis conducted on geographies consisting of 152,431,977 people shows a slight negative correlation between the proportion of British West Indians and poverty level among seniors over the age of 65 in the United States with a correlation coefficient (R) of -0.071 and weighted average of 15.6%. Similarly, the statistical analysis conducted on geographies consisting of 572,245,774 people shows a very strong positive correlation between the proportion of Hispanics or Latinos and poverty level among seniors over the age of 65 in the United States with a correlation coefficient (R) of 0.831 and weighted average of 14.3%, a difference of 8.9%.
Seniors Poverty Over the Age of 65 Correlation Summary
| Measurement | British West Indian | Hispanic or Latino |
| Minimum | 1.2% | 8.6% |
| Maximum | 29.2% | 40.6% |
| Range | 28.0% | 32.0% |
| Mean | 13.3% | 14.8% |
| Median | 13.3% | 13.8% |
| Interquartile 25% (IQ1) | 10.3% | 10.7% |
| Interquartile 75% (IQ3) | 17.3% | 17.2% |
| Interquartile Range (IQR) | 6.9% | 6.5% |
| Standard Deviation (Sample) | 5.8% | 5.6% |
| Standard Deviation (Population) | 5.8% | 5.6% |
Demographics Similar to British West Indians and Hispanics or Latinos by Seniors Poverty Over the Age of 65
In terms of seniors poverty over the age of 65, the demographic groups most similar to British West Indians are Immigrants from St. Vincent and the Grenadines (15.5%, a difference of 0.51%), Immigrants from Dominica (15.5%, a difference of 0.81%), Sioux (15.3%, a difference of 1.9%), Crow (15.2%, a difference of 2.5%), and Immigrants from Armenia (15.2%, a difference of 2.7%). Similarly, the demographic groups most similar to Hispanics or Latinos are Barbadian (14.4%, a difference of 0.37%), Native/Alaskan (14.2%, a difference of 0.54%), Guyanese (14.4%, a difference of 0.77%), Immigrants from Ecuador (14.4%, a difference of 0.80%), and Immigrants from Guyana (14.5%, a difference of 1.0%).
| Demographics | Rating | Rank | Seniors Poverty Over the Age of 65 |
| Natives/Alaskans | 0.0 /100 | #311 | Tragic 14.2% |
| Hispanics or Latinos | 0.0 /100 | #312 | Tragic 14.3% |
| Barbadians | 0.0 /100 | #313 | Tragic 14.4% |
| Guyanese | 0.0 /100 | #314 | Tragic 14.4% |
| Immigrants | Ecuador | 0.0 /100 | #315 | Tragic 14.4% |
| Immigrants | Guyana | 0.0 /100 | #316 | Tragic 14.5% |
| Haitians | 0.0 /100 | #317 | Tragic 14.5% |
| Immigrants | Honduras | 0.0 /100 | #318 | Tragic 14.5% |
| Cape Verdeans | 0.0 /100 | #319 | Tragic 14.7% |
| Immigrants | Haiti | 0.0 /100 | #320 | Tragic 14.7% |
| Houma | 0.0 /100 | #321 | Tragic 14.7% |
| Immigrants | Barbados | 0.0 /100 | #322 | Tragic 14.8% |
| Yakama | 0.0 /100 | #323 | Tragic 14.8% |
| Nicaraguans | 0.0 /100 | #324 | Tragic 15.0% |
| Central American Indians | 0.0 /100 | #325 | Tragic 15.1% |
| Immigrants | Armenia | 0.0 /100 | #326 | Tragic 15.2% |
| Crow | 0.0 /100 | #327 | Tragic 15.2% |
| Sioux | 0.0 /100 | #328 | Tragic 15.3% |
| Immigrants | Dominica | 0.0 /100 | #329 | Tragic 15.5% |
| Immigrants | St. Vincent and the Grenadines | 0.0 /100 | #330 | Tragic 15.5% |
| British West Indians | 0.0 /100 | #331 | Tragic 15.6% |