Immigrants from Kazakhstan vs Pueblo Female Poverty Among 25-34 Year Olds

COMPARE

Immigrants from Kazakhstan
Race
Ancestry
AfghanAfricanAlaska NativeAlaskan AthabascanAlbanianAleutAlsatianAmericanApacheArabArapahoArgentineanArmenianAssyrian/Chaldean/SyriacAustralianAustrianBahamianBangladeshiBarbadianBasqueBelgianBelizeanBermudanBhutaneseBlackfeetBolivianBrazilianBritishBritish West IndianBulgarianBurmeseCajunCambodianCanadianCape VerdeanCarpatho RusynCelticCentral AmericanCentral American IndianCherokeeCheyenneChickasawChileanChineseChippewaChoctawColombianColvilleComancheCosta RicanCreeCreekCroatianCrowCubanCypriotCzechCzechoslovakianDanishDelawareDominicanDutchDutch West IndianEastern EuropeanEcuadorianEgyptianEnglishEstonianEthiopianEuropeanFijianFilipinoFinnishFrenchFrench American IndianFrench CanadianGermanGerman RussianGhanaianGreekGuamanian/ChamorroGuatemalanGuyaneseHaitianHmongHonduranHopiHoumaHungarianIcelanderIndian (Asian)IndonesianInupiatIranianIraqiIrishIroquoisIsraeliItalianJamaicanJapaneseJordanianKenyanKiowaKoreanLaotianLatvianLebaneseLiberianLithuanianLumbeeLuxembourgerMacedonianMalaysianMalteseMarshalleseMenomineeMexicanMexican American IndianMongolianMoroccanNative HawaiianNavajoNepaleseNew ZealanderNicaraguanNigerianNorthern EuropeanNorwegianOkinawanOsageOttawaPaiutePakistaniPalestinianPanamanianParaguayanPennsylvania GermanPeruvianPimaPolishPortuguesePotawatomiPuerto RicanPuget Sound SalishRomanianRussianSalvadoranSamoanScandinavianScotch-IrishScottishSeminoleSenegaleseSerbianShoshoneSierra LeoneanSiouxSlavicSlovakSloveneSomaliSouth AfricanSouth AmericanSouth American IndianSoviet UnionSpaniardSpanishSpanish AmericanSpanish American IndianSri LankanSubsaharan AfricanSudaneseSwedishSwissSyrianTaiwaneseThaiTlingit-HaidaTohono O'OdhamTonganTrinidadian and TobagonianTsimshianTurkishU.S. Virgin IslanderUgandanUkrainianUruguayanUteVenezuelanVietnameseWelshWest IndianYakamaYaquiYugoslavianYumanYup'ikZimbabwean
Immigration
NonimmigrantsImmigrantsAfghanistanAfricaAlbaniaArgentinaArmeniaAsiaAustraliaAustriaBahamasBangladeshBarbadosBelarusBelgiumBelizeBoliviaBosnia and HerzegovinaBrazilBulgariaBurma/MyanmarCabo VerdeCambodiaCameroonCanadaCaribbeanCentral AmericaChileChinaColombiaCongoCosta RicaCroatiaCubaCzechoslovakiaDenmarkDominicaDominican RepublicEastern AfricaEastern AsiaEastern EuropeEcuadorEgyptEl SalvadorEnglandEritreaEthiopiaEuropeFijiFranceGermanyGhanaGreeceGrenadaGuatemalaGuyanaHaitiHondurasHong KongHungaryIndiaIndonesiaIranIraqIrelandIsraelItalyJamaicaJapanJordanKazakhstanKenyaKoreaKuwaitLaosLatin AmericaLatviaLebanonLiberiaLithuaniaMalaysiaMexicoMicronesiaMiddle AfricaMoldovaMoroccoNepalNetherlandsNicaraguaNigeriaNorth AmericaNorth MacedoniaNorthern AfricaNorthern EuropeNorwayOceaniaPakistanPanamaPeruPhilippinesPolandPortugalRomaniaRussiaSaudi ArabiaScotlandSenegalSerbiaSierra LeoneSingaporeSomaliaSouth AfricaSouth AmericaSouth Central AsiaSouth Eastern AsiaSouthern EuropeSpainSri LankaSt. Vincent and the GrenadinesSudanSwedenSwitzerlandSyriaTaiwanThailandTrinidad and TobagoTurkeyUgandaUkraineUruguayUzbekistanVenezuelaVietnamWest IndiesWestern AfricaWestern AsiaWestern EuropeYemenZaireZimbabweAzores
Pueblo
Race
Ancestry
AfghanAfricanAlaska NativeAlaskan AthabascanAlbanianAleutAlsatianAmericanApacheArabArapahoArgentineanArmenianAssyrian/Chaldean/SyriacAustralianAustrianBahamianBangladeshiBarbadianBasqueBelgianBelizeanBermudanBhutaneseBlackfeetBolivianBrazilianBritishBritish West IndianBulgarianBurmeseCajunCambodianCanadianCape VerdeanCarpatho RusynCelticCentral AmericanCentral American IndianCherokeeCheyenneChickasawChileanChineseChippewaChoctawColombianColvilleComancheCosta RicanCreeCreekCroatianCrowCubanCypriotCzechCzechoslovakianDanishDelawareDominicanDutchDutch West IndianEastern EuropeanEcuadorianEgyptianEnglishEstonianEthiopianEuropeanFijianFilipinoFinnishFrenchFrench American IndianFrench CanadianGermanGerman RussianGhanaianGreekGuamanian/ChamorroGuatemalanGuyaneseHaitianHmongHonduranHopiHoumaHungarianIcelanderIndian (Asian)IndonesianInupiatIranianIraqiIrishIroquoisIsraeliItalianJamaicanJapaneseJordanianKenyanKiowaKoreanLaotianLatvianLebaneseLiberianLithuanianLumbeeLuxembourgerMacedonianMalaysianMalteseMarshalleseMenomineeMexicanMexican American IndianMongolianMoroccanNative HawaiianNavajoNepaleseNew ZealanderNicaraguanNigerianNorthern EuropeanNorwegianOkinawanOsageOttawaPaiutePakistaniPalestinianPanamanianParaguayanPennsylvania GermanPeruvianPimaPolishPortuguesePotawatomiPuebloPuerto RicanPuget Sound SalishRomanianRussianSalvadoranSamoanScandinavianScotch-IrishScottishSeminoleSenegaleseSerbianShoshoneSierra LeoneanSiouxSlavicSlovakSloveneSomaliSouth AfricanSouth AmericanSouth American IndianSoviet UnionSpaniardSpanishSpanish AmericanSpanish American IndianSri LankanSubsaharan AfricanSudaneseSwedishSwissSyrianTaiwaneseThaiTlingit-HaidaTohono O'OdhamTonganTrinidadian and TobagonianTsimshianTurkishU.S. Virgin IslanderUgandanUkrainianUruguayanUteVenezuelanVietnameseWelshWest IndianYakamaYaquiYugoslavianYumanYup'ikZimbabwean
Immigration
NonimmigrantsImmigrantsAfghanistanAfricaAlbaniaArgentinaArmeniaAsiaAustraliaAustriaBahamasBangladeshBarbadosBelarusBelgiumBelizeBoliviaBosnia and HerzegovinaBrazilBulgariaBurma/MyanmarCabo VerdeCambodiaCameroonCanadaCaribbeanCentral AmericaChileChinaColombiaCongoCosta RicaCroatiaCubaCzechoslovakiaDenmarkDominicaDominican RepublicEastern AfricaEastern AsiaEastern EuropeEcuadorEgyptEl SalvadorEnglandEritreaEthiopiaEuropeFijiFranceGermanyGhanaGreeceGrenadaGuatemalaGuyanaHaitiHondurasHong KongHungaryIndiaIndonesiaIranIraqIrelandIsraelItalyJamaicaJapanJordanKenyaKoreaKuwaitLaosLatin AmericaLatviaLebanonLiberiaLithuaniaMalaysiaMexicoMicronesiaMiddle AfricaMoldovaMoroccoNepalNetherlandsNicaraguaNigeriaNorth AmericaNorth MacedoniaNorthern AfricaNorthern EuropeNorwayOceaniaPakistanPanamaPeruPhilippinesPolandPortugalRomaniaRussiaSaudi ArabiaScotlandSenegalSerbiaSierra LeoneSingaporeSomaliaSouth AfricaSouth AmericaSouth Central AsiaSouth Eastern AsiaSouthern EuropeSpainSri LankaSt. Vincent and the GrenadinesSudanSwedenSwitzerlandSyriaTaiwanThailandTrinidad and TobagoTurkeyUgandaUkraineUruguayUzbekistanVenezuelaVietnamWest IndiesWestern AfricaWestern AsiaWestern EuropeYemenZaireZimbabweAzores
Female Poverty Among 25-34 Year Olds
Income
Poverty
Unemployment
Labor Participation
Family Structure
Vehicle Availability
Education Level
Disability

Female Poverty Among 25-34 Year Olds Comparison

Immigrants from Kazakhstan

Pueblo

Exceptional
Tragic
12.4%
FEMALE POVERTY AMONG 25-34 YEAR OLDS
98.1/ 100
METRIC RATING
81st/ 347
METRIC RANK
22.2%
FEMALE POVERTY AMONG 25-34 YEAR OLDS
0.0/ 100
METRIC RATING
336th/ 347
METRIC RANK

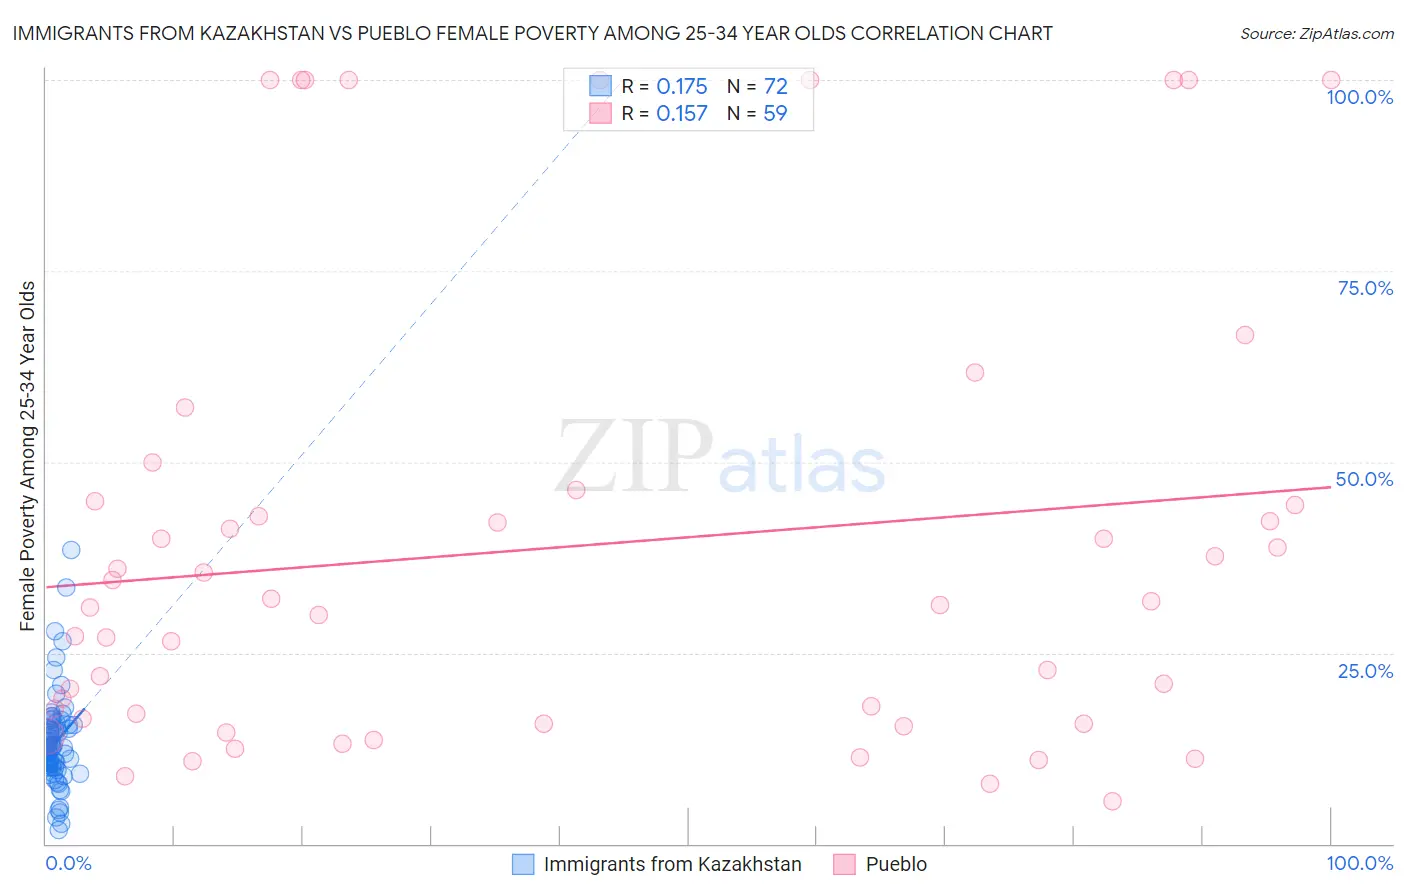
Immigrants from Kazakhstan vs Pueblo Female Poverty Among 25-34 Year Olds Correlation Chart

The statistical analysis conducted on geographies consisting of 123,655,702 people shows a poor positive correlation between the proportion of Immigrants from Kazakhstan and poverty level among females between the ages 25 and 34 in the United States with a correlation coefficient (R) of 0.175 and weighted average of 12.4%. Similarly, the statistical analysis conducted on geographies consisting of 119,661,710 people shows a poor positive correlation between the proportion of Pueblo and poverty level among females between the ages 25 and 34 in the United States with a correlation coefficient (R) of 0.157 and weighted average of 22.2%, a difference of 78.4%.
Immigrants from Kazakhstan vs Pueblo Female Poverty Among 25-34 Year Olds

Female Poverty Among 25-34 Year Olds Correlation Summary

MeasurementImmigrants from KazakhstanPueblo
Minimum1.8%5.6%
Maximum38.5%100.0%
Range36.6%94.4%
Mean13.3%38.9%
Median12.7%31.2%
Interquartile 25% (IQ1)10.0%15.8%
Interquartile 75% (IQ3)15.5%44.9%
Interquartile Range (IQR)5.5%29.1%
Standard Deviation (Sample)6.3%29.6%
Standard Deviation (Population)6.3%29.3%

Similar Demographics by Female Poverty Among 25-34 Year Olds

Demographics Similar to Immigrants from Kazakhstan by Female Poverty Among 25-34 Year Olds

In terms of female poverty among 25-34 year olds, the demographic groups most similar to Immigrants from Kazakhstan are Ethiopian (12.4%, a difference of 0.080%), Immigrants from Malaysia (12.4%, a difference of 0.24%), Albanian (12.5%, a difference of 0.40%), Immigrants from Latvia (12.5%, a difference of 0.46%), and Immigrants from Jordan (12.4%, a difference of 0.51%).
DemographicsRating | RankFemale Poverty Among 25-34 Year Olds
Immigrants | Sweden
98.9
/100
|
#74
Exceptional
12.3%
Estonians
98.9
/100
|
#75
Exceptional
12.3%
Greeks
98.9
/100
|
#76
Exceptional
12.3%
Immigrants | Italy
98.8
/100
|
#77
Exceptional
12.3%
Immigrants | Ukraine
98.6
/100
|
#78
Exceptional
12.3%
Immigrants | Jordan
98.5
/100
|
#79
Exceptional
12.4%
Immigrants | Malaysia
98.3
/100
|
#80
Exceptional
12.4%
Immigrants | Kazakhstan
98.1
/100
|
#81
Exceptional
12.4%
Ethiopians
98.0
/100
|
#82
Exceptional
12.4%
Albanians
97.7
/100
|
#83
Exceptional
12.5%
Immigrants | Latvia
97.7
/100
|
#84
Exceptional
12.5%
Immigrants | South Eastern Asia
97.6
/100
|
#85
Exceptional
12.5%
Croatians
97.5
/100
|
#86
Exceptional
12.5%
Argentineans
97.5
/100
|
#87
Exceptional
12.5%
Immigrants | Austria
97.4
/100
|
#88
Exceptional
12.5%

Demographics Similar to Pueblo by Female Poverty Among 25-34 Year Olds

In terms of female poverty among 25-34 year olds, the demographic groups most similar to Pueblo are Crow (22.7%, a difference of 2.3%), Houma (22.7%, a difference of 2.5%), Yuman (22.9%, a difference of 3.4%), Sioux (23.0%, a difference of 3.5%), and Navajo (23.3%, a difference of 5.3%).
DemographicsRating | RankFemale Poverty Among 25-34 Year Olds
Creek
0.0
/100
|
#329
Tragic
19.2%
Paiute
0.0
/100
|
#330
Tragic
19.6%
Kiowa
0.0
/100
|
#331
Tragic
19.7%
Immigrants | Yemen
0.0
/100
|
#332
Tragic
19.8%
Cajuns
0.0
/100
|
#333
Tragic
19.9%
Apache
0.0
/100
|
#334
Tragic
20.1%
Natives/Alaskans
0.0
/100
|
#335
Tragic
20.3%
Pueblo
0.0
/100
|
#336
Tragic
22.2%
Crow
0.0
/100
|
#337
Tragic
22.7%
Houma
0.0
/100
|
#338
Tragic
22.7%
Yuman
0.0
/100
|
#339
Tragic
22.9%
Sioux
0.0
/100
|
#340
Tragic
23.0%
Navajo
0.0
/100
|
#341
Tragic
23.3%
Hopi
0.0
/100
|
#342
Tragic
23.7%
Yup'ik
0.0
/100
|
#343
Tragic
24.3%