Immigrants from Jamaica vs Maltese Female Poverty Among 25-34 Year Olds
COMPARE
Immigrants from Jamaica
Maltese
Female Poverty Among 25-34 Year Olds
Female Poverty Among 25-34 Year Olds Comparison
Immigrants from Jamaica
Maltese
14.7%
FEMALE POVERTY AMONG 25-34 YEAR OLDS
1.4/ 100
METRIC RATING
235th/ 347
METRIC RANK
11.4%
FEMALE POVERTY AMONG 25-34 YEAR OLDS
99.9/ 100
METRIC RATING
24th/ 347
METRIC RANK
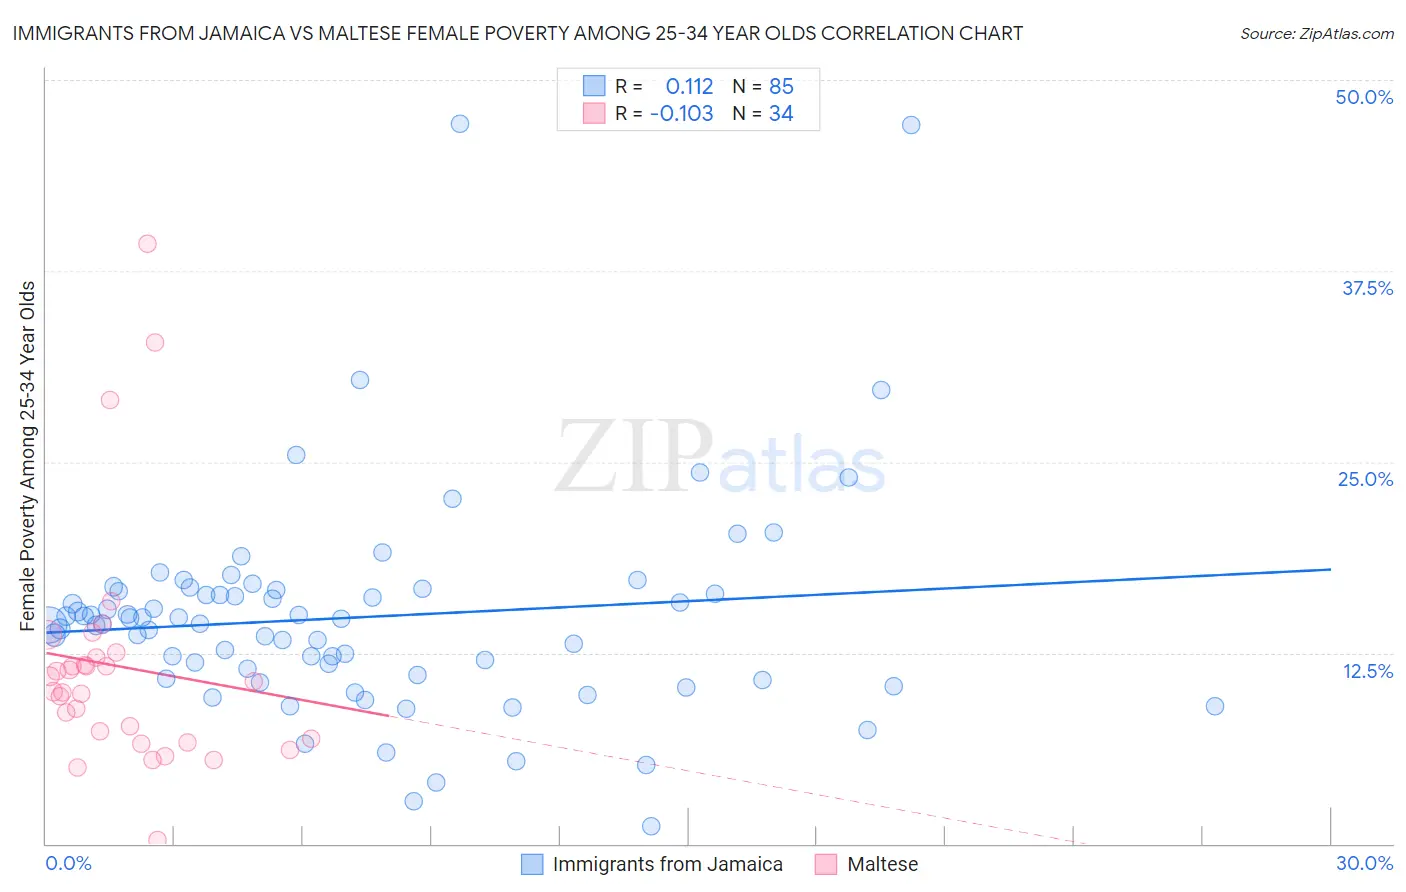
Immigrants from Jamaica vs Maltese Female Poverty Among 25-34 Year Olds Correlation Chart
The statistical analysis conducted on geographies consisting of 298,263,739 people shows a poor positive correlation between the proportion of Immigrants from Jamaica and poverty level among females between the ages 25 and 34 in the United States with a correlation coefficient (R) of 0.112 and weighted average of 14.7%. Similarly, the statistical analysis conducted on geographies consisting of 125,160,248 people shows a poor negative correlation between the proportion of Maltese and poverty level among females between the ages 25 and 34 in the United States with a correlation coefficient (R) of -0.103 and weighted average of 11.4%, a difference of 28.9%.
Female Poverty Among 25-34 Year Olds Correlation Summary
| Measurement | Immigrants from Jamaica | Maltese |
| Minimum | 1.1% | 0.28% |
| Maximum | 47.2% | 39.3% |
| Range | 46.0% | 39.0% |
| Mean | 14.8% | 11.6% |
| Median | 14.4% | 10.3% |
| Interquartile 25% (IQ1) | 10.9% | 6.9% |
| Interquartile 75% (IQ3) | 16.6% | 12.2% |
| Interquartile Range (IQR) | 5.7% | 5.3% |
| Standard Deviation (Sample) | 7.2% | 7.8% |
| Standard Deviation (Population) | 7.1% | 7.7% |
Similar Demographics by Female Poverty Among 25-34 Year Olds
Demographics Similar to Immigrants from Jamaica by Female Poverty Among 25-34 Year Olds
In terms of female poverty among 25-34 year olds, the demographic groups most similar to Immigrants from Jamaica are Salvadoran (14.7%, a difference of 0.020%), Immigrants from Ghana (14.7%, a difference of 0.020%), Alsatian (14.7%, a difference of 0.060%), Malaysian (14.7%, a difference of 0.090%), and Immigrants from Grenada (14.7%, a difference of 0.14%).
| Demographics | Rating | Rank | Female Poverty Among 25-34 Year Olds |
| Vietnamese | 2.6 /100 | #228 | Tragic 14.6% |
| Spanish | 2.5 /100 | #229 | Tragic 14.6% |
| Spaniards | 2.3 /100 | #230 | Tragic 14.6% |
| Delaware | 2.3 /100 | #231 | Tragic 14.6% |
| Immigrants | Ecuador | 1.9 /100 | #232 | Tragic 14.6% |
| Whites/Caucasians | 1.8 /100 | #233 | Tragic 14.7% |
| Cubans | 1.6 /100 | #234 | Tragic 14.7% |
| Immigrants | Jamaica | 1.4 /100 | #235 | Tragic 14.7% |
| Salvadorans | 1.4 /100 | #236 | Tragic 14.7% |
| Immigrants | Ghana | 1.4 /100 | #237 | Tragic 14.7% |
| Alsatians | 1.4 /100 | #238 | Tragic 14.7% |
| Malaysians | 1.4 /100 | #239 | Tragic 14.7% |
| Immigrants | Grenada | 1.3 /100 | #240 | Tragic 14.7% |
| Scotch-Irish | 1.2 /100 | #241 | Tragic 14.8% |
| Barbadians | 1.2 /100 | #242 | Tragic 14.8% |
Demographics Similar to Maltese by Female Poverty Among 25-34 Year Olds
In terms of female poverty among 25-34 year olds, the demographic groups most similar to Maltese are Bolivian (11.4%, a difference of 0.030%), Asian (11.4%, a difference of 0.090%), Bhutanese (11.4%, a difference of 0.22%), Turkish (11.4%, a difference of 0.24%), and Tongan (11.5%, a difference of 0.37%).
| Demographics | Rating | Rank | Female Poverty Among 25-34 Year Olds |
| Immigrants | China | 100.0 /100 | #17 | Exceptional 11.2% |
| Immigrants | Eastern Asia | 100.0 /100 | #18 | Exceptional 11.2% |
| Iranians | 100.0 /100 | #19 | Exceptional 11.2% |
| Okinawans | 100.0 /100 | #20 | Exceptional 11.3% |
| Turks | 100.0 /100 | #21 | Exceptional 11.4% |
| Asians | 99.9 /100 | #22 | Exceptional 11.4% |
| Bolivians | 99.9 /100 | #23 | Exceptional 11.4% |
| Maltese | 99.9 /100 | #24 | Exceptional 11.4% |
| Bhutanese | 99.9 /100 | #25 | Exceptional 11.4% |
| Tongans | 99.9 /100 | #26 | Exceptional 11.5% |
| Immigrants | Greece | 99.9 /100 | #27 | Exceptional 11.5% |
| Immigrants | Pakistan | 99.9 /100 | #28 | Exceptional 11.5% |
| Bulgarians | 99.9 /100 | #29 | Exceptional 11.5% |
| Cypriots | 99.9 /100 | #30 | Exceptional 11.5% |
| Immigrants | Japan | 99.9 /100 | #31 | Exceptional 11.6% |