Immigrants from Jamaica vs Haitian Female Poverty Among 25-34 Year Olds
COMPARE
Immigrants from Jamaica
Haitian
Female Poverty Among 25-34 Year Olds
Female Poverty Among 25-34 Year Olds Comparison
Immigrants from Jamaica
Haitians
14.7%
FEMALE POVERTY AMONG 25-34 YEAR OLDS
1.4/ 100
METRIC RATING
235th/ 347
METRIC RANK
15.0%
FEMALE POVERTY AMONG 25-34 YEAR OLDS
0.5/ 100
METRIC RATING
251st/ 347
METRIC RANK
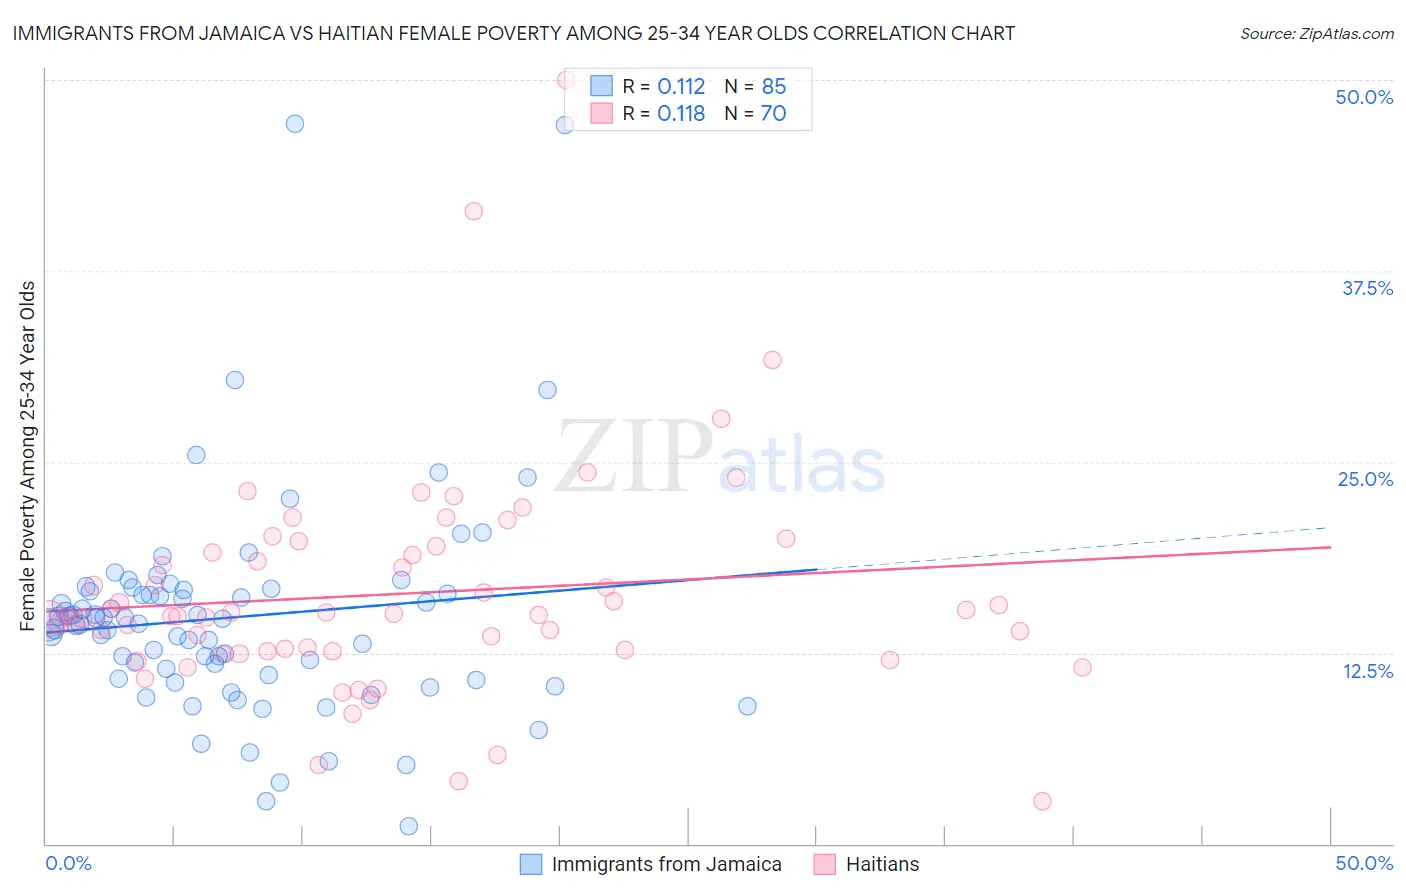
Immigrants from Jamaica vs Haitian Female Poverty Among 25-34 Year Olds Correlation Chart
The statistical analysis conducted on geographies consisting of 298,263,739 people shows a poor positive correlation between the proportion of Immigrants from Jamaica and poverty level among females between the ages 25 and 34 in the United States with a correlation coefficient (R) of 0.112 and weighted average of 14.7%. Similarly, the statistical analysis conducted on geographies consisting of 284,910,103 people shows a poor positive correlation between the proportion of Haitians and poverty level among females between the ages 25 and 34 in the United States with a correlation coefficient (R) of 0.118 and weighted average of 15.0%, a difference of 2.1%.
Female Poverty Among 25-34 Year Olds Correlation Summary
| Measurement | Immigrants from Jamaica | Haitian |
| Minimum | 1.1% | 2.8% |
| Maximum | 47.2% | 50.0% |
| Range | 46.0% | 47.2% |
| Mean | 14.8% | 16.4% |
| Median | 14.4% | 14.9% |
| Interquartile 25% (IQ1) | 10.9% | 12.6% |
| Interquartile 75% (IQ3) | 16.6% | 19.1% |
| Interquartile Range (IQR) | 5.7% | 6.4% |
| Standard Deviation (Sample) | 7.2% | 7.3% |
| Standard Deviation (Population) | 7.1% | 7.2% |
Demographics Similar to Immigrants from Jamaica and Haitians by Female Poverty Among 25-34 Year Olds
In terms of female poverty among 25-34 year olds, the demographic groups most similar to Immigrants from Jamaica are Salvadoran (14.7%, a difference of 0.020%), Immigrants from Ghana (14.7%, a difference of 0.020%), Alsatian (14.7%, a difference of 0.060%), Malaysian (14.7%, a difference of 0.090%), and Immigrants from Grenada (14.7%, a difference of 0.14%). Similarly, the demographic groups most similar to Haitians are Belizean (15.1%, a difference of 0.17%), Immigrants from El Salvador (15.0%, a difference of 0.19%), Immigrants from Haiti (15.0%, a difference of 0.22%), Immigrants from West Indies (15.1%, a difference of 0.31%), and Immigrants from Western Africa (14.9%, a difference of 1.1%).
| Demographics | Rating | Rank | Female Poverty Among 25-34 Year Olds |
| Whites/Caucasians | 1.8 /100 | #233 | Tragic 14.7% |
| Cubans | 1.6 /100 | #234 | Tragic 14.7% |
| Immigrants | Jamaica | 1.4 /100 | #235 | Tragic 14.7% |
| Salvadorans | 1.4 /100 | #236 | Tragic 14.7% |
| Immigrants | Ghana | 1.4 /100 | #237 | Tragic 14.7% |
| Alsatians | 1.4 /100 | #238 | Tragic 14.7% |
| Malaysians | 1.4 /100 | #239 | Tragic 14.7% |
| Immigrants | Grenada | 1.3 /100 | #240 | Tragic 14.7% |
| Scotch-Irish | 1.2 /100 | #241 | Tragic 14.8% |
| Barbadians | 1.2 /100 | #242 | Tragic 14.8% |
| Immigrants | Nicaragua | 1.1 /100 | #243 | Tragic 14.8% |
| Immigrants | Bangladesh | 1.1 /100 | #244 | Tragic 14.8% |
| Immigrants | Middle Africa | 1.0 /100 | #245 | Tragic 14.8% |
| Jamaicans | 1.0 /100 | #246 | Tragic 14.8% |
| German Russians | 0.8 /100 | #247 | Tragic 14.9% |
| Immigrants | Western Africa | 0.8 /100 | #248 | Tragic 14.9% |
| Immigrants | Haiti | 0.5 /100 | #249 | Tragic 15.0% |
| Immigrants | El Salvador | 0.5 /100 | #250 | Tragic 15.0% |
| Haitians | 0.5 /100 | #251 | Tragic 15.0% |
| Belizeans | 0.4 /100 | #252 | Tragic 15.1% |
| Immigrants | West Indies | 0.4 /100 | #253 | Tragic 15.1% |