Austrian vs Maltese Female Poverty Among 25-34 Year Olds
COMPARE
Austrian
Maltese
Female Poverty Among 25-34 Year Olds
Female Poverty Among 25-34 Year Olds Comparison
Austrians
Maltese
13.1%
FEMALE POVERTY AMONG 25-34 YEAR OLDS
83.7/ 100
METRIC RATING
139th/ 347
METRIC RANK
11.4%
FEMALE POVERTY AMONG 25-34 YEAR OLDS
99.9/ 100
METRIC RATING
24th/ 347
METRIC RANK
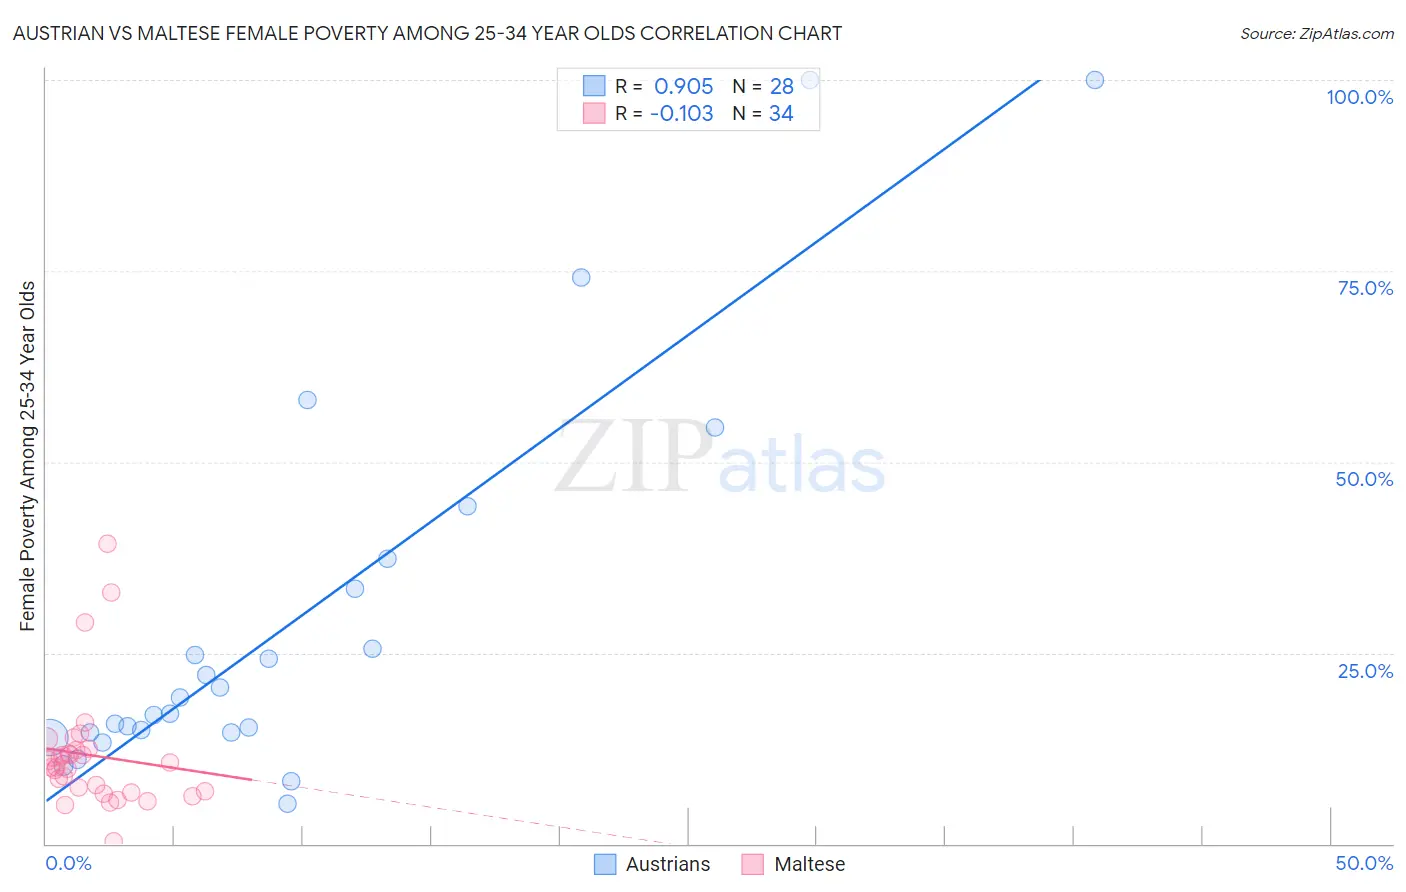
Austrian vs Maltese Female Poverty Among 25-34 Year Olds Correlation Chart
The statistical analysis conducted on geographies consisting of 440,453,770 people shows a near-perfect positive correlation between the proportion of Austrians and poverty level among females between the ages 25 and 34 in the United States with a correlation coefficient (R) of 0.905 and weighted average of 13.1%. Similarly, the statistical analysis conducted on geographies consisting of 125,160,248 people shows a poor negative correlation between the proportion of Maltese and poverty level among females between the ages 25 and 34 in the United States with a correlation coefficient (R) of -0.103 and weighted average of 11.4%, a difference of 14.4%.
Female Poverty Among 25-34 Year Olds Correlation Summary
| Measurement | Austrian | Maltese |
| Minimum | 5.2% | 0.28% |
| Maximum | 100.0% | 39.3% |
| Range | 94.8% | 39.0% |
| Mean | 29.4% | 11.6% |
| Median | 18.0% | 10.3% |
| Interquartile 25% (IQ1) | 14.6% | 6.9% |
| Interquartile 75% (IQ3) | 35.3% | 12.2% |
| Interquartile Range (IQR) | 20.7% | 5.3% |
| Standard Deviation (Sample) | 25.7% | 7.8% |
| Standard Deviation (Population) | 25.2% | 7.7% |
Similar Demographics by Female Poverty Among 25-34 Year Olds
Demographics Similar to Austrians by Female Poverty Among 25-34 Year Olds
In terms of female poverty among 25-34 year olds, the demographic groups most similar to Austrians are Immigrants from Iraq (13.1%, a difference of 0.020%), New Zealander (13.1%, a difference of 0.060%), Brazilian (13.1%, a difference of 0.13%), Immigrants from Chile (13.1%, a difference of 0.14%), and Scandinavian (13.1%, a difference of 0.21%).
| Demographics | Rating | Rank | Female Poverty Among 25-34 Year Olds |
| Immigrants | Hungary | 88.3 /100 | #132 | Excellent 13.0% |
| Serbians | 87.6 /100 | #133 | Excellent 13.0% |
| Afghans | 85.8 /100 | #134 | Excellent 13.0% |
| South Africans | 85.7 /100 | #135 | Excellent 13.0% |
| Immigrants | England | 85.5 /100 | #136 | Excellent 13.0% |
| Immigrants | Chile | 84.6 /100 | #137 | Excellent 13.1% |
| Brazilians | 84.5 /100 | #138 | Excellent 13.1% |
| Austrians | 83.7 /100 | #139 | Excellent 13.1% |
| Immigrants | Iraq | 83.6 /100 | #140 | Excellent 13.1% |
| New Zealanders | 83.4 /100 | #141 | Excellent 13.1% |
| Scandinavians | 82.3 /100 | #142 | Excellent 13.1% |
| Israelis | 81.9 /100 | #143 | Excellent 13.1% |
| Native Hawaiians | 78.9 /100 | #144 | Good 13.2% |
| Colombians | 77.2 /100 | #145 | Good 13.2% |
| South Americans | 76.9 /100 | #146 | Good 13.2% |
Demographics Similar to Maltese by Female Poverty Among 25-34 Year Olds
In terms of female poverty among 25-34 year olds, the demographic groups most similar to Maltese are Bolivian (11.4%, a difference of 0.030%), Asian (11.4%, a difference of 0.090%), Bhutanese (11.4%, a difference of 0.22%), Turkish (11.4%, a difference of 0.24%), and Tongan (11.5%, a difference of 0.37%).
| Demographics | Rating | Rank | Female Poverty Among 25-34 Year Olds |
| Immigrants | China | 100.0 /100 | #17 | Exceptional 11.2% |
| Immigrants | Eastern Asia | 100.0 /100 | #18 | Exceptional 11.2% |
| Iranians | 100.0 /100 | #19 | Exceptional 11.2% |
| Okinawans | 100.0 /100 | #20 | Exceptional 11.3% |
| Turks | 100.0 /100 | #21 | Exceptional 11.4% |
| Asians | 99.9 /100 | #22 | Exceptional 11.4% |
| Bolivians | 99.9 /100 | #23 | Exceptional 11.4% |
| Maltese | 99.9 /100 | #24 | Exceptional 11.4% |
| Bhutanese | 99.9 /100 | #25 | Exceptional 11.4% |
| Tongans | 99.9 /100 | #26 | Exceptional 11.5% |
| Immigrants | Greece | 99.9 /100 | #27 | Exceptional 11.5% |
| Immigrants | Pakistan | 99.9 /100 | #28 | Exceptional 11.5% |
| Bulgarians | 99.9 /100 | #29 | Exceptional 11.5% |
| Cypriots | 99.9 /100 | #30 | Exceptional 11.5% |
| Immigrants | Japan | 99.9 /100 | #31 | Exceptional 11.6% |