Immigrants from Israel vs Immigrants from Egypt Single Father Poverty
COMPARE
Immigrants from Israel
Immigrants from Egypt
Single Father Poverty
Single Father Poverty Comparison
Immigrants from Israel
Immigrants from Egypt
16.1%
SINGLE FATHER POVERTY
72.0/ 100
METRIC RATING
153rd/ 347
METRIC RANK
14.4%
SINGLE FATHER POVERTY
100.0/ 100
METRIC RATING
23rd/ 347
METRIC RANK
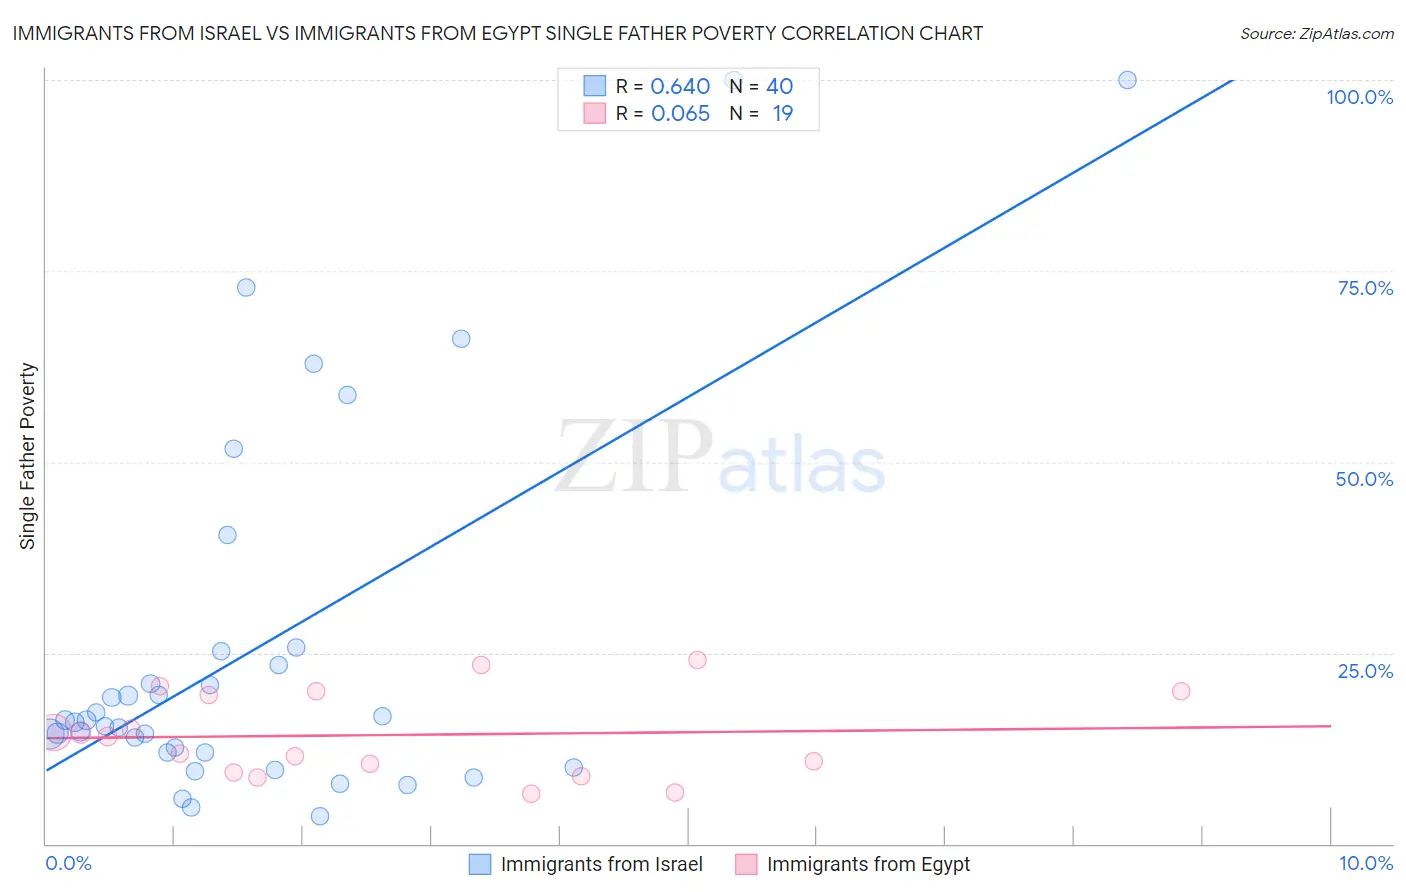
Immigrants from Israel vs Immigrants from Egypt Single Father Poverty Correlation Chart
The statistical analysis conducted on geographies consisting of 172,515,206 people shows a significant positive correlation between the proportion of Immigrants from Israel and poverty level among single fathers in the United States with a correlation coefficient (R) of 0.640 and weighted average of 16.1%. Similarly, the statistical analysis conducted on geographies consisting of 202,331,150 people shows a slight positive correlation between the proportion of Immigrants from Egypt and poverty level among single fathers in the United States with a correlation coefficient (R) of 0.065 and weighted average of 14.4%, a difference of 12.3%.
Single Father Poverty Correlation Summary
| Measurement | Immigrants from Israel | Immigrants from Egypt |
| Minimum | 3.6% | 6.6% |
| Maximum | 100.0% | 24.1% |
| Range | 96.4% | 17.6% |
| Mean | 25.4% | 14.2% |
| Median | 16.0% | 14.0% |
| Interquartile 25% (IQ1) | 11.9% | 9.3% |
| Interquartile 75% (IQ3) | 24.3% | 19.9% |
| Interquartile Range (IQR) | 12.4% | 10.6% |
| Standard Deviation (Sample) | 24.4% | 5.5% |
| Standard Deviation (Population) | 24.1% | 5.4% |
Similar Demographics by Single Father Poverty
Demographics Similar to Immigrants from Israel by Single Father Poverty
In terms of single father poverty, the demographic groups most similar to Immigrants from Israel are Immigrants from Zimbabwe (16.1%, a difference of 0.0%), Immigrants from France (16.1%, a difference of 0.060%), Mexican (16.1%, a difference of 0.10%), Jordanian (16.1%, a difference of 0.13%), and South African (16.1%, a difference of 0.18%).
| Demographics | Rating | Rank | Single Father Poverty |
| Immigrants | Hungary | 78.3 /100 | #146 | Good 16.1% |
| Colombians | 77.1 /100 | #147 | Good 16.1% |
| Nigerians | 76.8 /100 | #148 | Good 16.1% |
| South Africans | 75.1 /100 | #149 | Good 16.1% |
| Jordanians | 74.2 /100 | #150 | Good 16.1% |
| Immigrants | France | 73.1 /100 | #151 | Good 16.1% |
| Immigrants | Zimbabwe | 72.1 /100 | #152 | Good 16.1% |
| Immigrants | Israel | 72.0 /100 | #153 | Good 16.1% |
| Mexicans | 70.1 /100 | #154 | Good 16.1% |
| Immigrants | Nicaragua | 67.8 /100 | #155 | Good 16.2% |
| Immigrants | Jordan | 66.0 /100 | #156 | Good 16.2% |
| Immigrants | Czechoslovakia | 62.8 /100 | #157 | Good 16.2% |
| Portuguese | 62.3 /100 | #158 | Good 16.2% |
| Belizeans | 59.9 /100 | #159 | Average 16.2% |
| Immigrants | Sudan | 59.8 /100 | #160 | Average 16.2% |
Demographics Similar to Immigrants from Egypt by Single Father Poverty
In terms of single father poverty, the demographic groups most similar to Immigrants from Egypt are Immigrants from South Eastern Asia (14.4%, a difference of 0.010%), Iranian (14.4%, a difference of 0.040%), Taiwanese (14.3%, a difference of 0.21%), Spanish American Indian (14.4%, a difference of 0.46%), and Nepalese (14.4%, a difference of 0.52%).
| Demographics | Rating | Rank | Single Father Poverty |
| Immigrants | Iran | 100.0 /100 | #16 | Exceptional 14.2% |
| Immigrants | Hong Kong | 100.0 /100 | #17 | Exceptional 14.2% |
| Soviet Union | 100.0 /100 | #18 | Exceptional 14.3% |
| Immigrants | Iraq | 100.0 /100 | #19 | Exceptional 14.3% |
| Immigrants | Singapore | 100.0 /100 | #20 | Exceptional 14.3% |
| Immigrants | Afghanistan | 100.0 /100 | #21 | Exceptional 14.3% |
| Taiwanese | 100.0 /100 | #22 | Exceptional 14.3% |
| Immigrants | Egypt | 100.0 /100 | #23 | Exceptional 14.4% |
| Immigrants | South Eastern Asia | 100.0 /100 | #24 | Exceptional 14.4% |
| Iranians | 100.0 /100 | #25 | Exceptional 14.4% |
| Spanish American Indians | 100.0 /100 | #26 | Exceptional 14.4% |
| Nepalese | 100.0 /100 | #27 | Exceptional 14.4% |
| Immigrants | South Central Asia | 100.0 /100 | #28 | Exceptional 14.5% |
| Somalis | 100.0 /100 | #29 | Exceptional 14.5% |
| Thais | 100.0 /100 | #30 | Exceptional 14.5% |