Immigrants from Ireland vs Immigrants from Venezuela Single Male Poverty
COMPARE
Immigrants from Ireland
Immigrants from Venezuela
Single Male Poverty
Single Male Poverty Comparison
Immigrants from Ireland
Immigrants from Venezuela
12.1%
SINGLE MALE POVERTY
98.3/ 100
METRIC RATING
89th/ 347
METRIC RANK
12.0%
SINGLE MALE POVERTY
99.1/ 100
METRIC RATING
78th/ 347
METRIC RANK
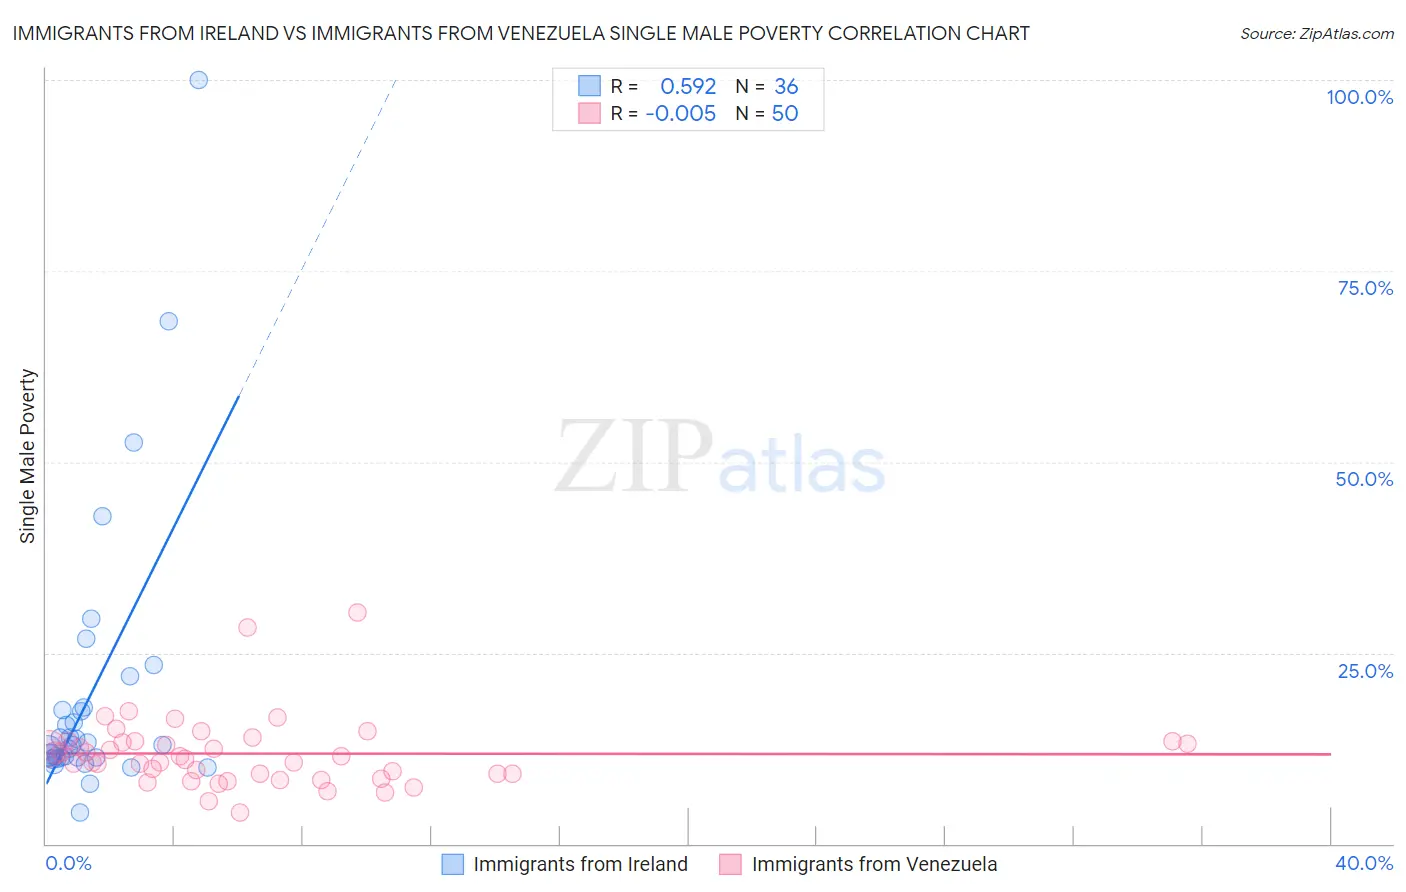
Immigrants from Ireland vs Immigrants from Venezuela Single Male Poverty Correlation Chart
The statistical analysis conducted on geographies consisting of 214,866,077 people shows a substantial positive correlation between the proportion of Immigrants from Ireland and poverty level among single males in the United States with a correlation coefficient (R) of 0.592 and weighted average of 12.1%. Similarly, the statistical analysis conducted on geographies consisting of 262,929,765 people shows no correlation between the proportion of Immigrants from Venezuela and poverty level among single males in the United States with a correlation coefficient (R) of -0.005 and weighted average of 12.0%, a difference of 0.94%.
Single Male Poverty Correlation Summary
| Measurement | Immigrants from Ireland | Immigrants from Venezuela |
| Minimum | 4.1% | 4.1% |
| Maximum | 100.0% | 30.2% |
| Range | 95.9% | 26.1% |
| Mean | 19.7% | 11.8% |
| Median | 13.0% | 11.3% |
| Interquartile 25% (IQ1) | 11.2% | 9.1% |
| Interquartile 75% (IQ3) | 17.6% | 13.5% |
| Interquartile Range (IQR) | 6.4% | 4.4% |
| Standard Deviation (Sample) | 18.8% | 4.7% |
| Standard Deviation (Population) | 18.5% | 4.6% |
Demographics Similar to Immigrants from Ireland and Immigrants from Venezuela by Single Male Poverty
In terms of single male poverty, the demographic groups most similar to Immigrants from Ireland are South American Indian (12.1%, a difference of 0.0%), Immigrants from Turkey (12.1%, a difference of 0.060%), Spanish American Indian (12.1%, a difference of 0.16%), Immigrants from Eritrea (12.1%, a difference of 0.17%), and South American (12.1%, a difference of 0.18%). Similarly, the demographic groups most similar to Immigrants from Venezuela are Immigrants from Belgium (12.0%, a difference of 0.10%), Immigrants from Malaysia (12.0%, a difference of 0.25%), Immigrants from Northern Africa (11.9%, a difference of 0.52%), Uruguayan (11.9%, a difference of 0.54%), and Armenian (12.1%, a difference of 0.54%).
| Demographics | Rating | Rank | Single Male Poverty |
| Argentineans | 99.5 /100 | #73 | Exceptional 11.9% |
| Chileans | 99.5 /100 | #74 | Exceptional 11.9% |
| Uruguayans | 99.4 /100 | #75 | Exceptional 11.9% |
| Immigrants | Northern Africa | 99.4 /100 | #76 | Exceptional 11.9% |
| Immigrants | Malaysia | 99.2 /100 | #77 | Exceptional 12.0% |
| Immigrants | Venezuela | 99.1 /100 | #78 | Exceptional 12.0% |
| Immigrants | Belgium | 99.0 /100 | #79 | Exceptional 12.0% |
| Armenians | 98.7 /100 | #80 | Exceptional 12.1% |
| Immigrants | South America | 98.7 /100 | #81 | Exceptional 12.1% |
| Immigrants | Colombia | 98.6 /100 | #82 | Exceptional 12.1% |
| Immigrants | Chile | 98.6 /100 | #83 | Exceptional 12.1% |
| Immigrants | Czechoslovakia | 98.6 /100 | #84 | Exceptional 12.1% |
| Turks | 98.5 /100 | #85 | Exceptional 12.1% |
| Immigrants | Israel | 98.5 /100 | #86 | Exceptional 12.1% |
| South Americans | 98.5 /100 | #87 | Exceptional 12.1% |
| Immigrants | Eritrea | 98.5 /100 | #88 | Exceptional 12.1% |
| Immigrants | Ireland | 98.3 /100 | #89 | Exceptional 12.1% |
| South American Indians | 98.3 /100 | #90 | Exceptional 12.1% |
| Immigrants | Turkey | 98.2 /100 | #91 | Exceptional 12.1% |
| Spanish American Indians | 98.0 /100 | #92 | Exceptional 12.1% |
| Immigrants | Bosnia and Herzegovina | 97.9 /100 | #93 | Exceptional 12.1% |