Immigrants from Iraq vs Yup'ik Child Poverty Under the Age of 5
COMPARE
Immigrants from Iraq
Yup'ik
Child Poverty Under the Age of 5
Child Poverty Under the Age of 5 Comparison
Immigrants from Iraq
Yup'ik
17.3%
CHILD POVERTY UNDER THE AGE OF 5
45.2/ 100
METRIC RATING
176th/ 347
METRIC RANK
27.7%
CHILD POVERTY UNDER THE AGE OF 5
0.0/ 100
METRIC RATING
339th/ 347
METRIC RANK
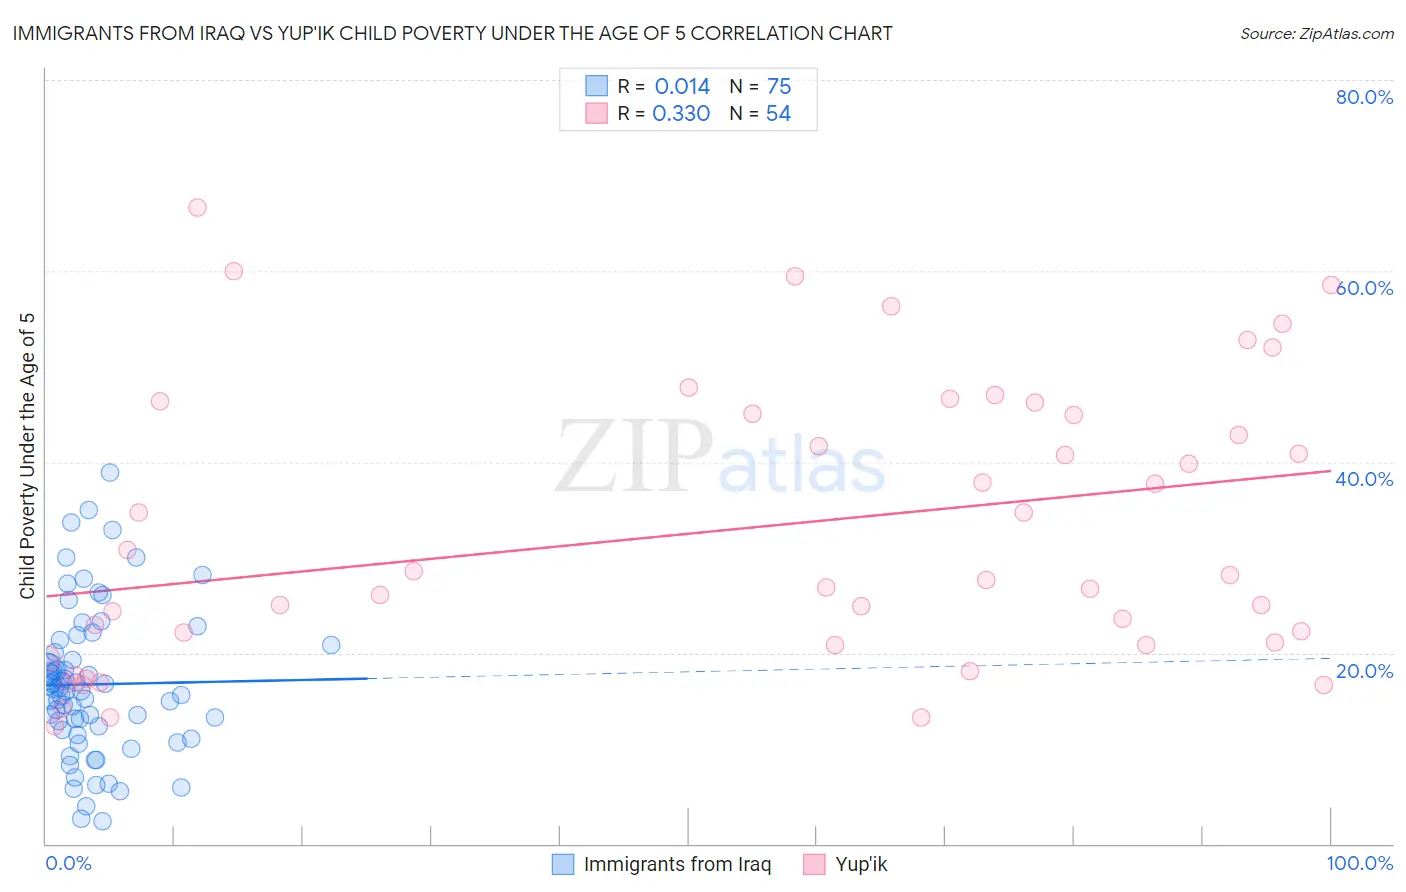
Immigrants from Iraq vs Yup'ik Child Poverty Under the Age of 5 Correlation Chart
The statistical analysis conducted on geographies consisting of 190,454,654 people shows no correlation between the proportion of Immigrants from Iraq and poverty level among children under the age of 5 in the United States with a correlation coefficient (R) of 0.014 and weighted average of 17.3%. Similarly, the statistical analysis conducted on geographies consisting of 39,533,777 people shows a mild positive correlation between the proportion of Yup'ik and poverty level among children under the age of 5 in the United States with a correlation coefficient (R) of 0.330 and weighted average of 27.7%, a difference of 60.1%.
Child Poverty Under the Age of 5 Correlation Summary
| Measurement | Immigrants from Iraq | Yup'ik |
| Minimum | 2.4% | 12.3% |
| Maximum | 38.9% | 66.7% |
| Range | 36.5% | 54.4% |
| Mean | 16.7% | 32.9% |
| Median | 16.0% | 27.8% |
| Interquartile 25% (IQ1) | 11.9% | 20.8% |
| Interquartile 75% (IQ3) | 20.9% | 45.0% |
| Interquartile Range (IQR) | 9.0% | 24.2% |
| Standard Deviation (Sample) | 7.7% | 14.7% |
| Standard Deviation (Population) | 7.7% | 14.6% |
Similar Demographics by Child Poverty Under the Age of 5
Demographics Similar to Immigrants from Iraq by Child Poverty Under the Age of 5
In terms of child poverty under the age of 5, the demographic groups most similar to Immigrants from Iraq are Immigrants from Sierra Leone (17.3%, a difference of 0.16%), Immigrants from Lebanon (17.3%, a difference of 0.25%), Immigrants from Cameroon (17.4%, a difference of 0.26%), Hawaiian (17.4%, a difference of 0.39%), and South American Indian (17.4%, a difference of 0.40%).
| Demographics | Rating | Rank | Child Poverty Under the Age of 5 |
| Immigrants | South America | 60.0 /100 | #169 | Good 17.1% |
| Immigrants | Western Asia | 59.2 /100 | #170 | Average 17.1% |
| Immigrants | Morocco | 58.9 /100 | #171 | Average 17.1% |
| Yugoslavians | 54.1 /100 | #172 | Average 17.2% |
| Welsh | 54.0 /100 | #173 | Average 17.2% |
| Immigrants | Saudi Arabia | 50.0 /100 | #174 | Average 17.2% |
| Immigrants | Lebanon | 47.6 /100 | #175 | Average 17.3% |
| Immigrants | Iraq | 45.2 /100 | #176 | Average 17.3% |
| Immigrants | Sierra Leone | 43.6 /100 | #177 | Average 17.3% |
| Immigrants | Cameroon | 42.7 /100 | #178 | Average 17.4% |
| Hawaiians | 41.5 /100 | #179 | Average 17.4% |
| South American Indians | 41.4 /100 | #180 | Average 17.4% |
| Immigrants | Germany | 41.0 /100 | #181 | Average 17.4% |
| Arabs | 40.7 /100 | #182 | Average 17.4% |
| Lebanese | 40.3 /100 | #183 | Average 17.4% |
Demographics Similar to Yup'ik by Child Poverty Under the Age of 5
In terms of child poverty under the age of 5, the demographic groups most similar to Yup'ik are Hopi (27.7%, a difference of 0.070%), Pima (27.4%, a difference of 1.1%), Cheyenne (28.3%, a difference of 2.2%), Sioux (26.9%, a difference of 3.0%), and Immigrants from Yemen (29.3%, a difference of 5.7%).
| Demographics | Rating | Rank | Child Poverty Under the Age of 5 |
| Apache | 0.0 /100 | #332 | Tragic 25.0% |
| Natives/Alaskans | 0.0 /100 | #333 | Tragic 25.6% |
| Blacks/African Americans | 0.0 /100 | #334 | Tragic 25.7% |
| Colville | 0.0 /100 | #335 | Tragic 25.7% |
| Sioux | 0.0 /100 | #336 | Tragic 26.9% |
| Pima | 0.0 /100 | #337 | Tragic 27.4% |
| Hopi | 0.0 /100 | #338 | Tragic 27.7% |
| Yup'ik | 0.0 /100 | #339 | Tragic 27.7% |
| Cheyenne | 0.0 /100 | #340 | Tragic 28.3% |
| Immigrants | Yemen | 0.0 /100 | #341 | Tragic 29.3% |
| Tohono O'odham | 0.0 /100 | #342 | Tragic 29.5% |
| Yuman | 0.0 /100 | #343 | Tragic 29.5% |
| Crow | 0.0 /100 | #344 | Tragic 31.0% |
| Navajo | 0.0 /100 | #345 | Tragic 31.6% |
| Lumbee | 0.0 /100 | #346 | Tragic 33.3% |