Immigrants from Indonesia vs Immigrants from Kuwait Female Poverty Among 25-34 Year Olds
COMPARE
Immigrants from Indonesia
Immigrants from Kuwait
Female Poverty Among 25-34 Year Olds
Female Poverty Among 25-34 Year Olds Comparison
Immigrants from Indonesia
Immigrants from Kuwait
11.8%
FEMALE POVERTY AMONG 25-34 YEAR OLDS
99.8/ 100
METRIC RATING
41st/ 347
METRIC RANK
12.8%
FEMALE POVERTY AMONG 25-34 YEAR OLDS
93.1/ 100
METRIC RATING
117th/ 347
METRIC RANK
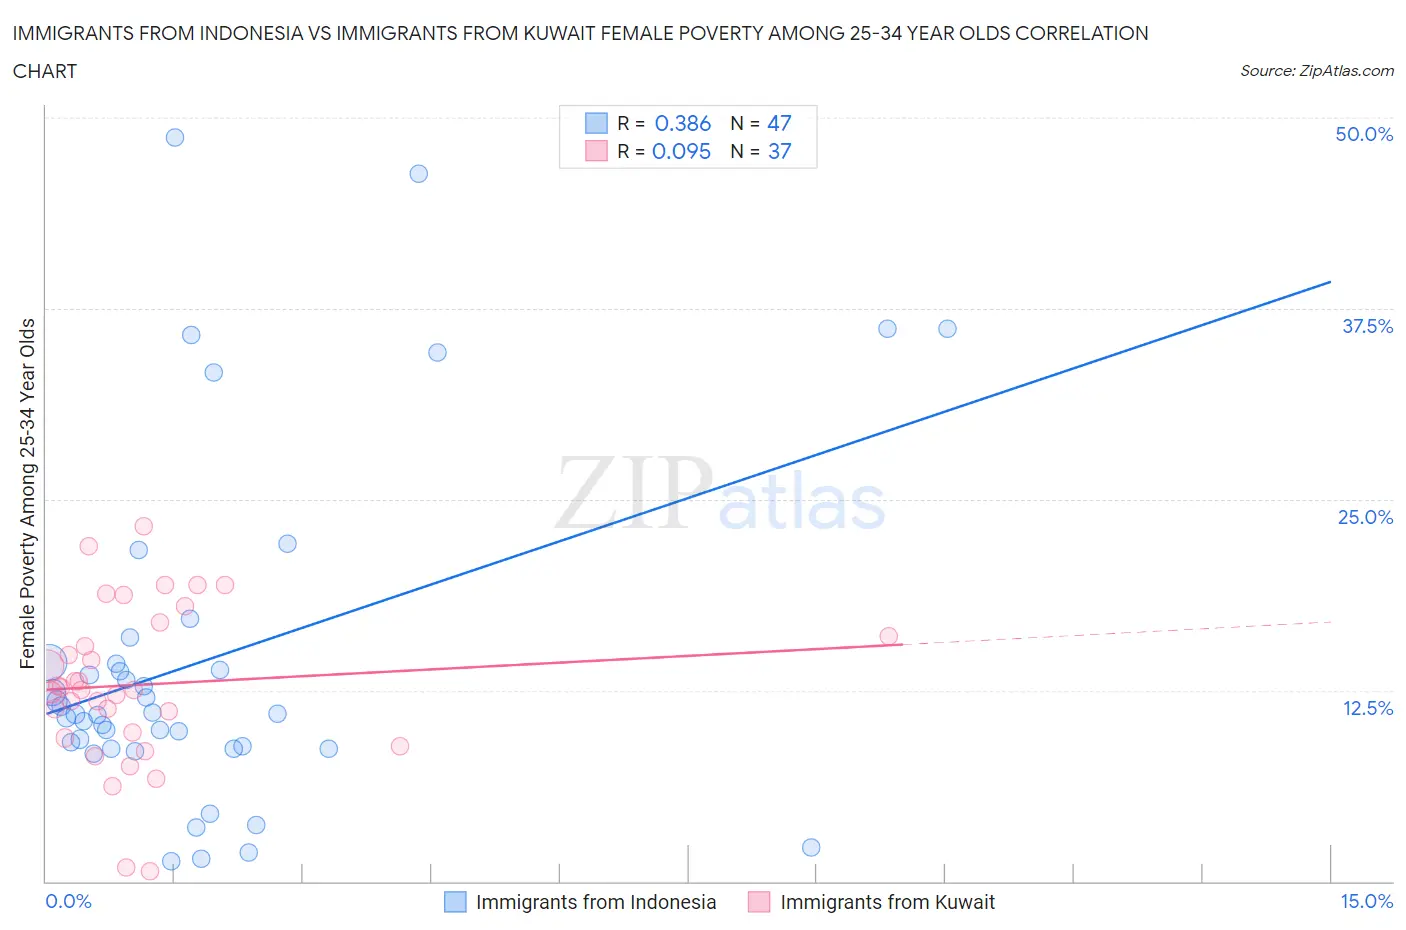
Immigrants from Indonesia vs Immigrants from Kuwait Female Poverty Among 25-34 Year Olds Correlation Chart
The statistical analysis conducted on geographies consisting of 214,279,540 people shows a mild positive correlation between the proportion of Immigrants from Indonesia and poverty level among females between the ages 25 and 34 in the United States with a correlation coefficient (R) of 0.386 and weighted average of 11.8%. Similarly, the statistical analysis conducted on geographies consisting of 136,324,073 people shows a slight positive correlation between the proportion of Immigrants from Kuwait and poverty level among females between the ages 25 and 34 in the United States with a correlation coefficient (R) of 0.095 and weighted average of 12.8%, a difference of 8.1%.
Female Poverty Among 25-34 Year Olds Correlation Summary
| Measurement | Immigrants from Indonesia | Immigrants from Kuwait |
| Minimum | 1.3% | 0.66% |
| Maximum | 48.7% | 23.2% |
| Range | 47.4% | 22.6% |
| Mean | 14.6% | 12.9% |
| Median | 11.0% | 12.6% |
| Interquartile 25% (IQ1) | 8.7% | 9.5% |
| Interquartile 75% (IQ3) | 14.3% | 16.5% |
| Interquartile Range (IQR) | 5.6% | 6.9% |
| Standard Deviation (Sample) | 11.3% | 5.1% |
| Standard Deviation (Population) | 11.2% | 5.1% |
Similar Demographics by Female Poverty Among 25-34 Year Olds
Demographics Similar to Immigrants from Indonesia by Female Poverty Among 25-34 Year Olds
In terms of female poverty among 25-34 year olds, the demographic groups most similar to Immigrants from Indonesia are Immigrants from Bulgaria (11.8%, a difference of 0.13%), Latvian (11.8%, a difference of 0.29%), Immigrants from Turkey (11.9%, a difference of 0.30%), Immigrants from North Macedonia (11.8%, a difference of 0.54%), and Egyptian (11.9%, a difference of 0.55%).
| Demographics | Rating | Rank | Female Poverty Among 25-34 Year Olds |
| Zimbabweans | 99.9 /100 | #34 | Exceptional 11.7% |
| Cambodians | 99.9 /100 | #35 | Exceptional 11.7% |
| Immigrants | Sri Lanka | 99.8 /100 | #36 | Exceptional 11.8% |
| Taiwanese | 99.8 /100 | #37 | Exceptional 11.8% |
| Immigrants | North Macedonia | 99.8 /100 | #38 | Exceptional 11.8% |
| Latvians | 99.8 /100 | #39 | Exceptional 11.8% |
| Immigrants | Bulgaria | 99.8 /100 | #40 | Exceptional 11.8% |
| Immigrants | Indonesia | 99.8 /100 | #41 | Exceptional 11.8% |
| Immigrants | Turkey | 99.7 /100 | #42 | Exceptional 11.9% |
| Egyptians | 99.7 /100 | #43 | Exceptional 11.9% |
| Immigrants | Australia | 99.7 /100 | #44 | Exceptional 11.9% |
| Macedonians | 99.7 /100 | #45 | Exceptional 11.9% |
| Immigrants | Serbia | 99.7 /100 | #46 | Exceptional 11.9% |
| Koreans | 99.6 /100 | #47 | Exceptional 12.0% |
| Immigrants | Belarus | 99.6 /100 | #48 | Exceptional 12.0% |
Demographics Similar to Immigrants from Kuwait by Female Poverty Among 25-34 Year Olds
In terms of female poverty among 25-34 year olds, the demographic groups most similar to Immigrants from Kuwait are Mongolian (12.8%, a difference of 0.010%), Immigrants from Nepal (12.8%, a difference of 0.020%), Carpatho Rusyn (12.8%, a difference of 0.030%), Chilean (12.8%, a difference of 0.060%), and Immigrants from Brazil (12.8%, a difference of 0.090%).
| Demographics | Rating | Rank | Female Poverty Among 25-34 Year Olds |
| Australians | 94.1 /100 | #110 | Exceptional 12.8% |
| Danes | 93.9 /100 | #111 | Exceptional 12.8% |
| Immigrants | Morocco | 93.9 /100 | #112 | Exceptional 12.8% |
| Immigrants | Syria | 93.8 /100 | #113 | Exceptional 12.8% |
| Immigrants | Southern Europe | 93.6 /100 | #114 | Exceptional 12.8% |
| Immigrants | Brazil | 93.3 /100 | #115 | Exceptional 12.8% |
| Chileans | 93.2 /100 | #116 | Exceptional 12.8% |
| Immigrants | Kuwait | 93.1 /100 | #117 | Exceptional 12.8% |
| Mongolians | 93.0 /100 | #118 | Exceptional 12.8% |
| Immigrants | Nepal | 93.0 /100 | #119 | Exceptional 12.8% |
| Carpatho Rusyns | 93.0 /100 | #120 | Exceptional 12.8% |
| Romanians | 92.8 /100 | #121 | Exceptional 12.8% |
| Immigrants | Western Asia | 92.7 /100 | #122 | Exceptional 12.8% |
| Slovenes | 92.7 /100 | #123 | Exceptional 12.8% |
| Immigrants | Netherlands | 92.0 /100 | #124 | Exceptional 12.8% |