Immigrants from Hong Kong vs Alaska Native Child Poverty Under the Age of 16
COMPARE
Immigrants from Hong Kong
Alaska Native
Child Poverty Under the Age of 16
Child Poverty Under the Age of 16 Comparison
Immigrants from Hong Kong
Alaska Natives
12.1%
CHILD POVERTY UNDER THE AGE OF 16
100.0/ 100
METRIC RATING
6th/ 347
METRIC RANK
17.2%
CHILD POVERTY UNDER THE AGE OF 16
11.8/ 100
METRIC RATING
206th/ 347
METRIC RANK
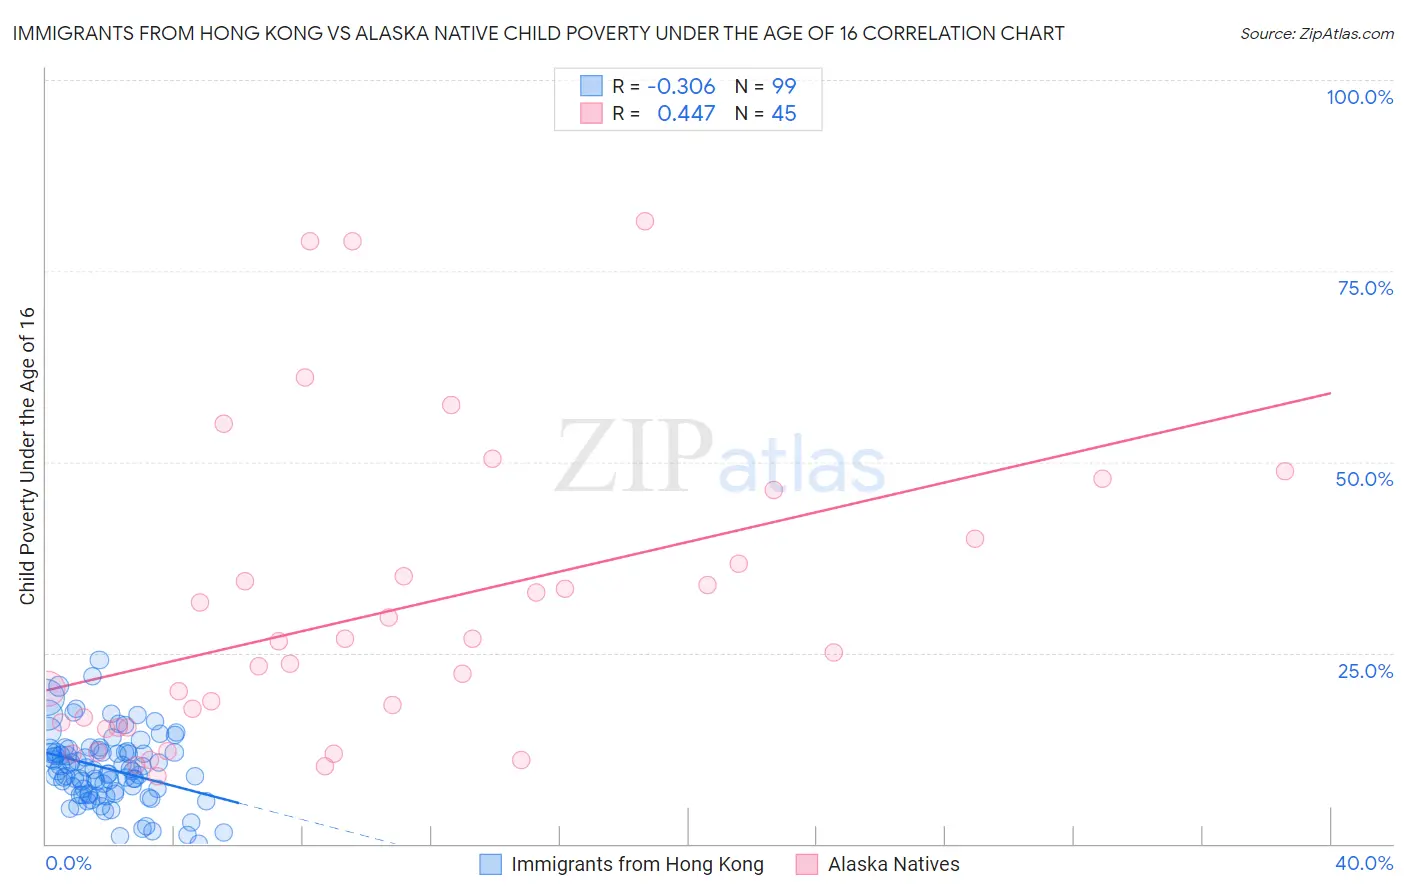
Immigrants from Hong Kong vs Alaska Native Child Poverty Under the Age of 16 Correlation Chart
The statistical analysis conducted on geographies consisting of 252,108,322 people shows a mild negative correlation between the proportion of Immigrants from Hong Kong and poverty level among children under the age of 16 in the United States with a correlation coefficient (R) of -0.306 and weighted average of 12.1%. Similarly, the statistical analysis conducted on geographies consisting of 76,612,165 people shows a moderate positive correlation between the proportion of Alaska Natives and poverty level among children under the age of 16 in the United States with a correlation coefficient (R) of 0.447 and weighted average of 17.2%, a difference of 41.5%.
Child Poverty Under the Age of 16 Correlation Summary
| Measurement | Immigrants from Hong Kong | Alaska Native |
| Minimum | 0.035% | 8.9% |
| Maximum | 24.0% | 81.6% |
| Range | 24.0% | 72.7% |
| Mean | 9.9% | 30.2% |
| Median | 9.5% | 25.0% |
| Interquartile 25% (IQ1) | 6.6% | 15.2% |
| Interquartile 75% (IQ3) | 12.2% | 38.3% |
| Interquartile Range (IQR) | 5.6% | 23.1% |
| Standard Deviation (Sample) | 4.6% | 19.4% |
| Standard Deviation (Population) | 4.6% | 19.1% |
Similar Demographics by Child Poverty Under the Age of 16
Demographics Similar to Immigrants from Hong Kong by Child Poverty Under the Age of 16
In terms of child poverty under the age of 16, the demographic groups most similar to Immigrants from Hong Kong are Iranian (12.2%, a difference of 0.76%), Chinese (11.9%, a difference of 1.8%), Immigrants from Singapore (12.4%, a difference of 1.9%), Immigrants from Iran (12.4%, a difference of 2.0%), and Immigrants from South Central Asia (12.5%, a difference of 3.2%).
| Demographics | Rating | Rank | Child Poverty Under the Age of 16 |
| Immigrants | India | 100.0 /100 | #1 | Exceptional 10.8% |
| Immigrants | Taiwan | 100.0 /100 | #2 | Exceptional 11.0% |
| Filipinos | 100.0 /100 | #3 | Exceptional 11.1% |
| Thais | 100.0 /100 | #4 | Exceptional 11.6% |
| Chinese | 100.0 /100 | #5 | Exceptional 11.9% |
| Immigrants | Hong Kong | 100.0 /100 | #6 | Exceptional 12.1% |
| Iranians | 100.0 /100 | #7 | Exceptional 12.2% |
| Immigrants | Singapore | 100.0 /100 | #8 | Exceptional 12.4% |
| Immigrants | Iran | 100.0 /100 | #9 | Exceptional 12.4% |
| Immigrants | South Central Asia | 99.9 /100 | #10 | Exceptional 12.5% |
| Bhutanese | 99.9 /100 | #11 | Exceptional 12.5% |
| Immigrants | Ireland | 99.9 /100 | #12 | Exceptional 12.7% |
| Burmese | 99.9 /100 | #13 | Exceptional 12.8% |
| Immigrants | Lithuania | 99.9 /100 | #14 | Exceptional 12.9% |
| Immigrants | Korea | 99.9 /100 | #15 | Exceptional 13.0% |
Demographics Similar to Alaska Natives by Child Poverty Under the Age of 16
In terms of child poverty under the age of 16, the demographic groups most similar to Alaska Natives are Aleut (17.1%, a difference of 0.54%), Hmong (17.1%, a difference of 0.55%), Immigrants from Sierra Leone (17.1%, a difference of 0.61%), Ugandan (17.1%, a difference of 0.63%), and Immigrants from Uzbekistan (17.1%, a difference of 0.71%).
| Demographics | Rating | Rank | Child Poverty Under the Age of 16 |
| Immigrants | Afghanistan | 15.1 /100 | #199 | Poor 17.0% |
| Immigrants | Cameroon | 14.7 /100 | #200 | Poor 17.1% |
| Immigrants | Uzbekistan | 14.7 /100 | #201 | Poor 17.1% |
| Ugandans | 14.3 /100 | #202 | Poor 17.1% |
| Immigrants | Sierra Leone | 14.2 /100 | #203 | Poor 17.1% |
| Hmong | 14.0 /100 | #204 | Poor 17.1% |
| Aleuts | 13.9 /100 | #205 | Poor 17.1% |
| Alaska Natives | 11.8 /100 | #206 | Poor 17.2% |
| German Russians | 8.6 /100 | #207 | Tragic 17.4% |
| Pennsylvania Germans | 7.5 /100 | #208 | Tragic 17.4% |
| Panamanians | 6.9 /100 | #209 | Tragic 17.5% |
| Alaskan Athabascans | 6.9 /100 | #210 | Tragic 17.5% |
| Immigrants | Thailand | 6.6 /100 | #211 | Tragic 17.5% |
| Immigrants | Immigrants | 6.5 /100 | #212 | Tragic 17.5% |
| Immigrants | Azores | 6.2 /100 | #213 | Tragic 17.5% |