Immigrants from Honduras vs Taiwanese Child Poverty Under the Age of 16
COMPARE
Immigrants from Honduras
Taiwanese
Child Poverty Under the Age of 16
Child Poverty Under the Age of 16 Comparison
Immigrants from Honduras
Taiwanese
22.7%
CHILD POVERTY UNDER THE AGE OF 16
0.0/ 100
METRIC RATING
326th/ 347
METRIC RANK
14.5%
CHILD POVERTY UNDER THE AGE OF 16
97.1/ 100
METRIC RATING
87th/ 347
METRIC RANK
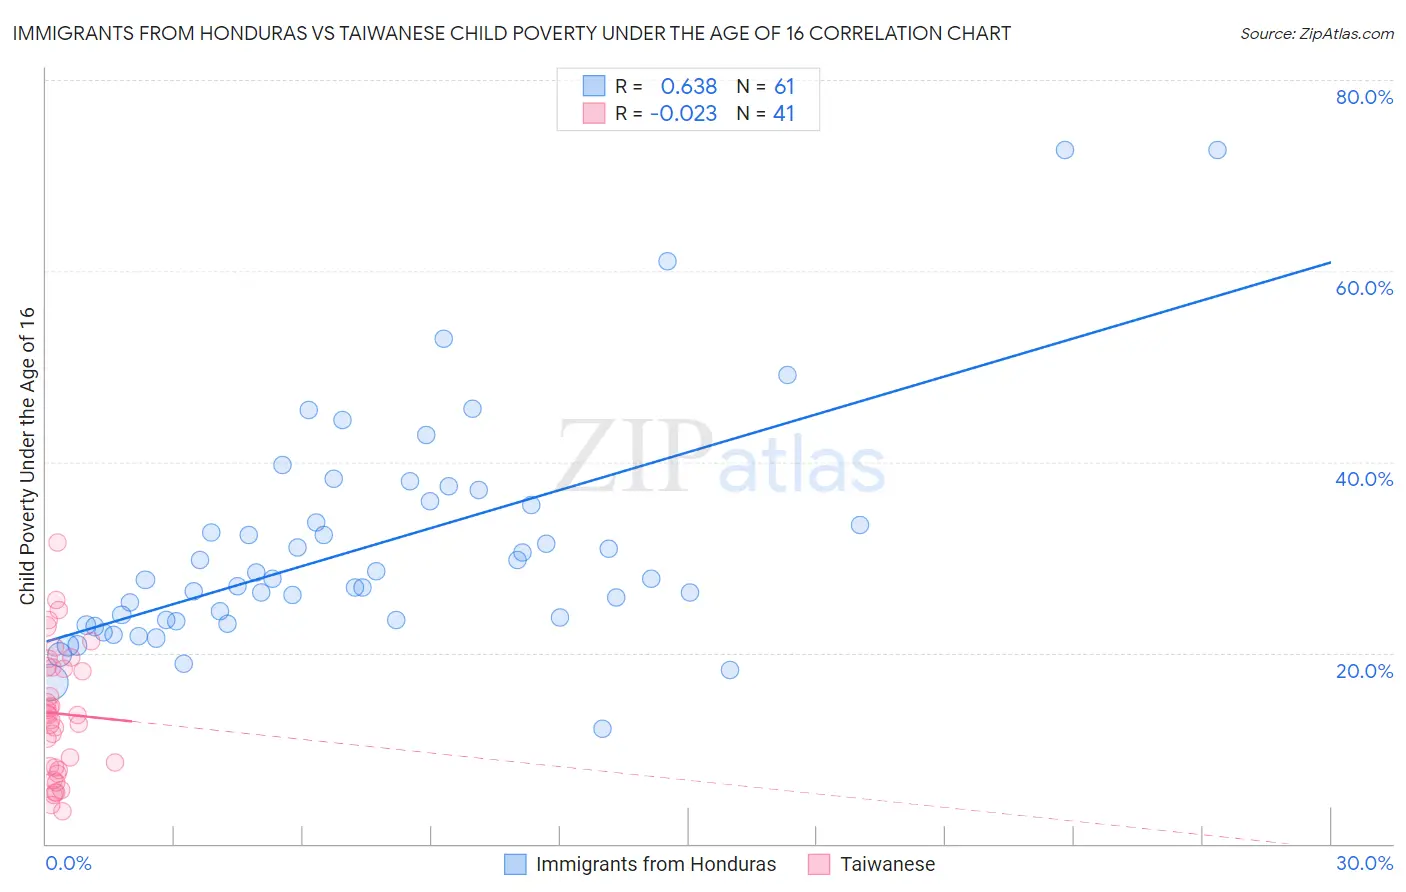
Immigrants from Honduras vs Taiwanese Child Poverty Under the Age of 16 Correlation Chart
The statistical analysis conducted on geographies consisting of 321,492,241 people shows a significant positive correlation between the proportion of Immigrants from Honduras and poverty level among children under the age of 16 in the United States with a correlation coefficient (R) of 0.638 and weighted average of 22.7%. Similarly, the statistical analysis conducted on geographies consisting of 31,625,785 people shows no correlation between the proportion of Taiwanese and poverty level among children under the age of 16 in the United States with a correlation coefficient (R) of -0.023 and weighted average of 14.5%, a difference of 56.6%.
Child Poverty Under the Age of 16 Correlation Summary
| Measurement | Immigrants from Honduras | Taiwanese |
| Minimum | 12.0% | 3.4% |
| Maximum | 72.7% | 31.5% |
| Range | 60.7% | 28.1% |
| Mean | 31.1% | 13.6% |
| Median | 27.7% | 13.4% |
| Interquartile 25% (IQ1) | 23.4% | 7.9% |
| Interquartile 75% (IQ3) | 35.7% | 18.5% |
| Interquartile Range (IQR) | 12.3% | 10.6% |
| Standard Deviation (Sample) | 11.9% | 6.7% |
| Standard Deviation (Population) | 11.8% | 6.6% |
Similar Demographics by Child Poverty Under the Age of 16
Demographics Similar to Immigrants from Honduras by Child Poverty Under the Age of 16
In terms of child poverty under the age of 16, the demographic groups most similar to Immigrants from Honduras are Immigrants from Congo (22.5%, a difference of 0.81%), Central American Indian (22.5%, a difference of 0.95%), Menominee (23.0%, a difference of 1.1%), Paiute (22.4%, a difference of 1.3%), and Colville (23.0%, a difference of 1.5%).
| Demographics | Rating | Rank | Child Poverty Under the Age of 16 |
| Yakama | 0.0 /100 | #319 | Tragic 22.1% |
| Cajuns | 0.0 /100 | #320 | Tragic 22.1% |
| Kiowa | 0.0 /100 | #321 | Tragic 22.2% |
| Hondurans | 0.0 /100 | #322 | Tragic 22.2% |
| Paiute | 0.0 /100 | #323 | Tragic 22.4% |
| Central American Indians | 0.0 /100 | #324 | Tragic 22.5% |
| Immigrants | Congo | 0.0 /100 | #325 | Tragic 22.5% |
| Immigrants | Honduras | 0.0 /100 | #326 | Tragic 22.7% |
| Menominee | 0.0 /100 | #327 | Tragic 23.0% |
| Colville | 0.0 /100 | #328 | Tragic 23.0% |
| Dominicans | 0.0 /100 | #329 | Tragic 23.8% |
| Natives/Alaskans | 0.0 /100 | #330 | Tragic 23.8% |
| Apache | 0.0 /100 | #331 | Tragic 23.8% |
| Pueblo | 0.0 /100 | #332 | Tragic 23.9% |
| Immigrants | Dominican Republic | 0.0 /100 | #333 | Tragic 24.0% |
Demographics Similar to Taiwanese by Child Poverty Under the Age of 16
In terms of child poverty under the age of 16, the demographic groups most similar to Taiwanese are Immigrants from Argentina (14.5%, a difference of 0.0%), Soviet Union (14.5%, a difference of 0.080%), Immigrants from Latvia (14.5%, a difference of 0.10%), Northern European (14.5%, a difference of 0.10%), and Egyptian (14.5%, a difference of 0.12%).
| Demographics | Rating | Rank | Child Poverty Under the Age of 16 |
| Immigrants | North Macedonia | 97.2 /100 | #80 | Exceptional 14.5% |
| Finns | 97.2 /100 | #81 | Exceptional 14.5% |
| Immigrants | Canada | 97.2 /100 | #82 | Exceptional 14.5% |
| Egyptians | 97.2 /100 | #83 | Exceptional 14.5% |
| Immigrants | Latvia | 97.1 /100 | #84 | Exceptional 14.5% |
| Soviet Union | 97.1 /100 | #85 | Exceptional 14.5% |
| Immigrants | Argentina | 97.1 /100 | #86 | Exceptional 14.5% |
| Taiwanese | 97.1 /100 | #87 | Exceptional 14.5% |
| Northern Europeans | 97.0 /100 | #88 | Exceptional 14.5% |
| Germans | 96.9 /100 | #89 | Exceptional 14.5% |
| Austrians | 96.9 /100 | #90 | Exceptional 14.5% |
| Immigrants | North America | 96.7 /100 | #91 | Exceptional 14.6% |
| Immigrants | Italy | 96.7 /100 | #92 | Exceptional 14.6% |
| Argentineans | 96.6 /100 | #93 | Exceptional 14.6% |
| Immigrants | South Africa | 96.3 /100 | #94 | Exceptional 14.6% |