Immigrants from Honduras vs Immigrants from Grenada Female Poverty
COMPARE
Immigrants from Honduras
Immigrants from Grenada
Female Poverty
Female Poverty Comparison
Immigrants from Honduras
Immigrants from Grenada
17.7%
FEMALE POVERTY
0.0/ 100
METRIC RATING
324th/ 347
METRIC RANK
16.8%
FEMALE POVERTY
0.0/ 100
METRIC RATING
305th/ 347
METRIC RANK
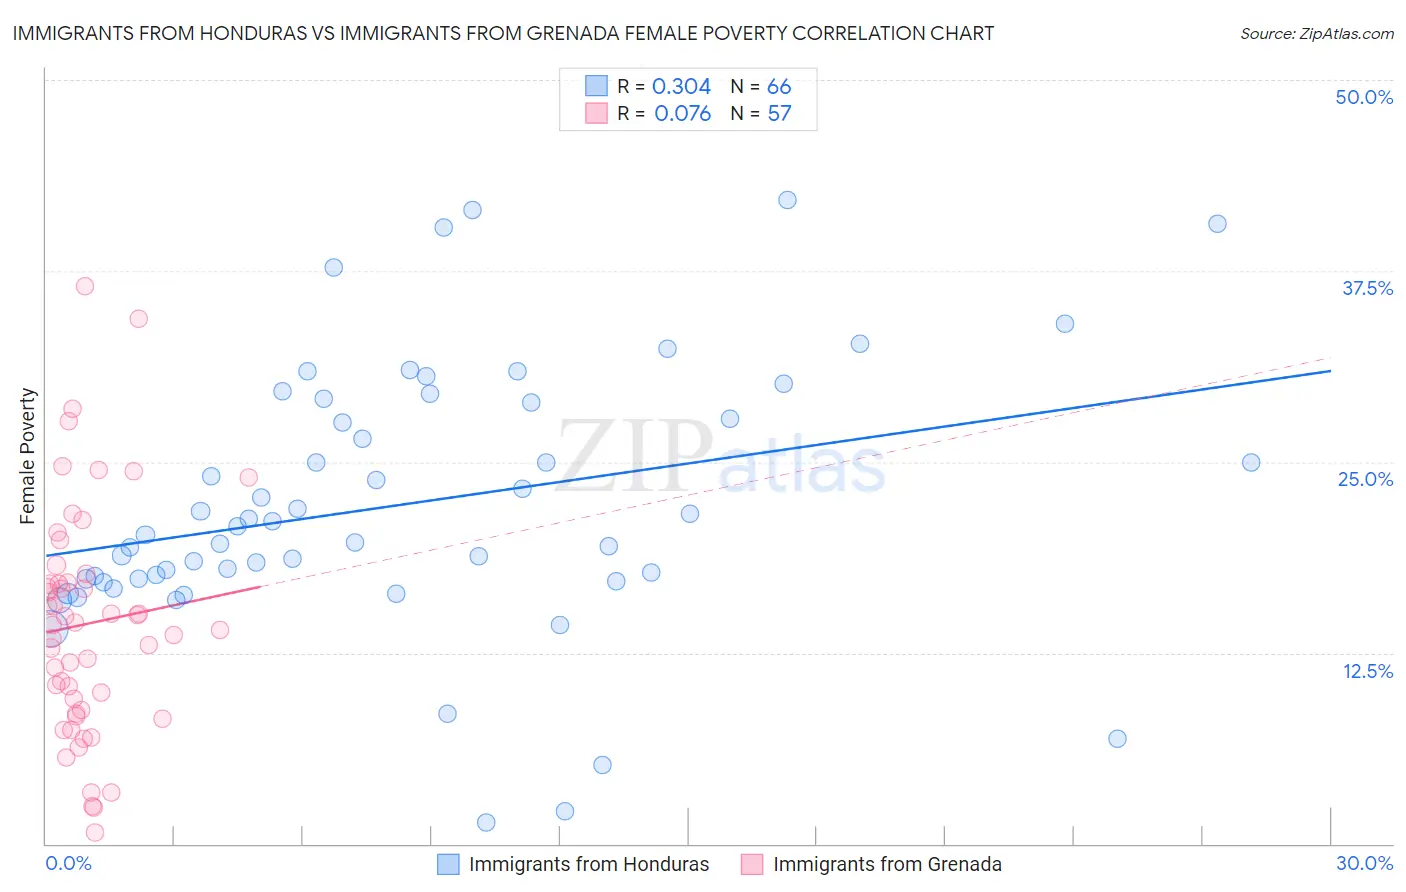
Immigrants from Honduras vs Immigrants from Grenada Female Poverty Correlation Chart
The statistical analysis conducted on geographies consisting of 322,443,203 people shows a mild positive correlation between the proportion of Immigrants from Honduras and poverty level among females in the United States with a correlation coefficient (R) of 0.304 and weighted average of 17.7%. Similarly, the statistical analysis conducted on geographies consisting of 67,188,736 people shows a slight positive correlation between the proportion of Immigrants from Grenada and poverty level among females in the United States with a correlation coefficient (R) of 0.076 and weighted average of 16.8%, a difference of 5.4%.
Female Poverty Correlation Summary
| Measurement | Immigrants from Honduras | Immigrants from Grenada |
| Minimum | 1.4% | 0.74% |
| Maximum | 42.1% | 36.5% |
| Range | 40.7% | 35.8% |
| Mean | 22.2% | 14.4% |
| Median | 20.5% | 14.3% |
| Interquartile 25% (IQ1) | 17.4% | 8.6% |
| Interquartile 75% (IQ3) | 28.9% | 17.4% |
| Interquartile Range (IQR) | 11.5% | 8.8% |
| Standard Deviation (Sample) | 8.7% | 7.6% |
| Standard Deviation (Population) | 8.6% | 7.5% |
Demographics Similar to Immigrants from Honduras and Immigrants from Grenada by Female Poverty
In terms of female poverty, the demographic groups most similar to Immigrants from Honduras are Paiute (17.7%, a difference of 0.18%), Menominee (17.6%, a difference of 0.77%), Arapaho (17.5%, a difference of 1.4%), Immigrants from Dominica (17.5%, a difference of 1.5%), and Cajun (17.5%, a difference of 1.6%). Similarly, the demographic groups most similar to Immigrants from Grenada are Immigrants from Central America (16.8%, a difference of 0.0%), Immigrants from Caribbean (16.9%, a difference of 0.27%), Seminole (16.9%, a difference of 0.39%), African (16.9%, a difference of 0.45%), and Immigrants from Mexico (17.0%, a difference of 0.84%).
| Demographics | Rating | Rank | Female Poverty |
| Immigrants | Central America | 0.0 /100 | #304 | Tragic 16.8% |
| Immigrants | Grenada | 0.0 /100 | #305 | Tragic 16.8% |
| Immigrants | Caribbean | 0.0 /100 | #306 | Tragic 16.9% |
| Seminole | 0.0 /100 | #307 | Tragic 16.9% |
| Africans | 0.0 /100 | #308 | Tragic 16.9% |
| Immigrants | Mexico | 0.0 /100 | #309 | Tragic 17.0% |
| Creek | 0.0 /100 | #310 | Tragic 17.0% |
| Immigrants | Guatemala | 0.0 /100 | #311 | Tragic 17.0% |
| Immigrants | Somalia | 0.0 /100 | #312 | Tragic 17.0% |
| British West Indians | 0.0 /100 | #313 | Tragic 17.0% |
| Dutch West Indians | 0.0 /100 | #314 | Tragic 17.1% |
| U.S. Virgin Islanders | 0.0 /100 | #315 | Tragic 17.3% |
| Hondurans | 0.0 /100 | #316 | Tragic 17.4% |
| Immigrants | Congo | 0.0 /100 | #317 | Tragic 17.4% |
| Ute | 0.0 /100 | #318 | Tragic 17.5% |
| Cajuns | 0.0 /100 | #319 | Tragic 17.5% |
| Immigrants | Dominica | 0.0 /100 | #320 | Tragic 17.5% |
| Arapaho | 0.0 /100 | #321 | Tragic 17.5% |
| Menominee | 0.0 /100 | #322 | Tragic 17.6% |
| Paiute | 0.0 /100 | #323 | Tragic 17.7% |
| Immigrants | Honduras | 0.0 /100 | #324 | Tragic 17.7% |