Immigrants from Ethiopia vs Immigrants from Grenada Female Poverty
COMPARE
Immigrants from Ethiopia
Immigrants from Grenada
Female Poverty
Female Poverty Comparison
Immigrants from Ethiopia
Immigrants from Grenada
13.3%
FEMALE POVERTY
62.5/ 100
METRIC RATING
161st/ 347
METRIC RANK
16.8%
FEMALE POVERTY
0.0/ 100
METRIC RATING
305th/ 347
METRIC RANK
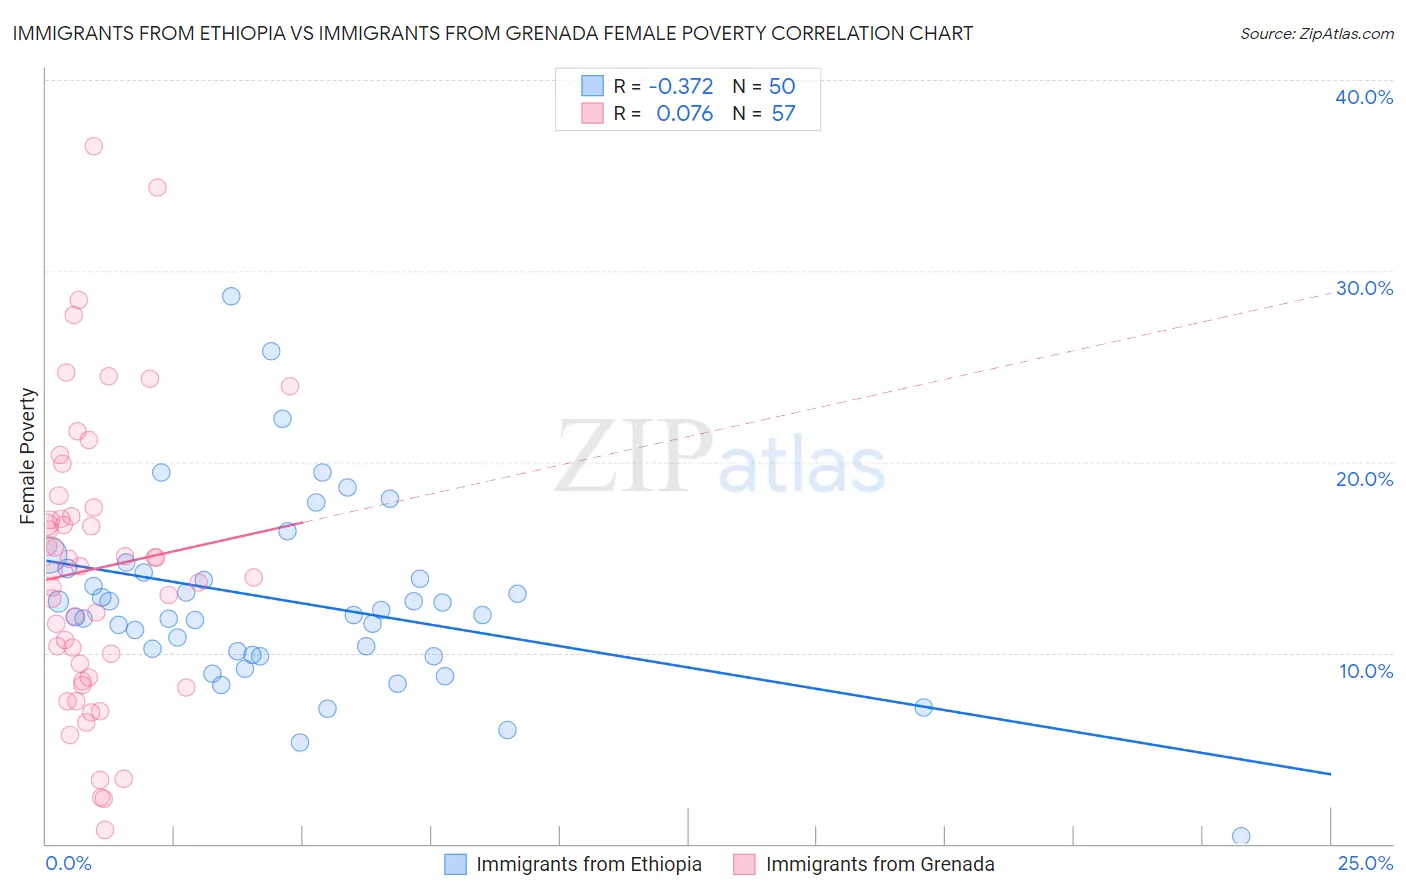
Immigrants from Ethiopia vs Immigrants from Grenada Female Poverty Correlation Chart
The statistical analysis conducted on geographies consisting of 211,427,583 people shows a mild negative correlation between the proportion of Immigrants from Ethiopia and poverty level among females in the United States with a correlation coefficient (R) of -0.372 and weighted average of 13.3%. Similarly, the statistical analysis conducted on geographies consisting of 67,188,736 people shows a slight positive correlation between the proportion of Immigrants from Grenada and poverty level among females in the United States with a correlation coefficient (R) of 0.076 and weighted average of 16.8%, a difference of 26.7%.
Female Poverty Correlation Summary
| Measurement | Immigrants from Ethiopia | Immigrants from Grenada |
| Minimum | 0.38% | 0.74% |
| Maximum | 28.7% | 36.5% |
| Range | 28.3% | 35.8% |
| Mean | 12.7% | 14.4% |
| Median | 12.0% | 14.3% |
| Interquartile 25% (IQ1) | 9.9% | 8.6% |
| Interquartile 75% (IQ3) | 14.2% | 17.4% |
| Interquartile Range (IQR) | 4.4% | 8.8% |
| Standard Deviation (Sample) | 4.9% | 7.6% |
| Standard Deviation (Population) | 4.9% | 7.5% |
Similar Demographics by Female Poverty
Demographics Similar to Immigrants from Ethiopia by Female Poverty
In terms of female poverty, the demographic groups most similar to Immigrants from Ethiopia are Guamanian/Chamorro (13.3%, a difference of 0.010%), Immigrants from Albania (13.3%, a difference of 0.010%), Ethiopian (13.3%, a difference of 0.020%), Immigrants from Nepal (13.3%, a difference of 0.030%), and Scotch-Irish (13.3%, a difference of 0.040%).
| Demographics | Rating | Rank | Female Poverty |
| Armenians | 70.4 /100 | #154 | Good 13.2% |
| Hungarians | 70.1 /100 | #155 | Good 13.2% |
| Immigrants | Bosnia and Herzegovina | 69.7 /100 | #156 | Good 13.2% |
| Immigrants | Northern Africa | 68.8 /100 | #157 | Good 13.2% |
| Pennsylvania Germans | 67.3 /100 | #158 | Good 13.2% |
| Costa Ricans | 63.6 /100 | #159 | Good 13.3% |
| Immigrants | Nepal | 62.7 /100 | #160 | Good 13.3% |
| Immigrants | Ethiopia | 62.5 /100 | #161 | Good 13.3% |
| Guamanians/Chamorros | 62.4 /100 | #162 | Good 13.3% |
| Immigrants | Albania | 62.4 /100 | #163 | Good 13.3% |
| Ethiopians | 62.3 /100 | #164 | Good 13.3% |
| Scotch-Irish | 62.1 /100 | #165 | Good 13.3% |
| Immigrants | Oceania | 59.7 /100 | #166 | Average 13.3% |
| Immigrants | Chile | 57.4 /100 | #167 | Average 13.3% |
| Aleuts | 56.7 /100 | #168 | Average 13.4% |
Demographics Similar to Immigrants from Grenada by Female Poverty
In terms of female poverty, the demographic groups most similar to Immigrants from Grenada are Immigrants from Central America (16.8%, a difference of 0.0%), Choctaw (16.8%, a difference of 0.070%), Immigrants from Caribbean (16.9%, a difference of 0.27%), Seminole (16.9%, a difference of 0.39%), and African (16.9%, a difference of 0.45%).
| Demographics | Rating | Rank | Female Poverty |
| Somalis | 0.0 /100 | #298 | Tragic 16.6% |
| Hispanics or Latinos | 0.0 /100 | #299 | Tragic 16.6% |
| Bahamians | 0.0 /100 | #300 | Tragic 16.6% |
| Guatemalans | 0.0 /100 | #301 | Tragic 16.7% |
| Chippewa | 0.0 /100 | #302 | Tragic 16.7% |
| Choctaw | 0.0 /100 | #303 | Tragic 16.8% |
| Immigrants | Central America | 0.0 /100 | #304 | Tragic 16.8% |
| Immigrants | Grenada | 0.0 /100 | #305 | Tragic 16.8% |
| Immigrants | Caribbean | 0.0 /100 | #306 | Tragic 16.9% |
| Seminole | 0.0 /100 | #307 | Tragic 16.9% |
| Africans | 0.0 /100 | #308 | Tragic 16.9% |
| Immigrants | Mexico | 0.0 /100 | #309 | Tragic 17.0% |
| Creek | 0.0 /100 | #310 | Tragic 17.0% |
| Immigrants | Guatemala | 0.0 /100 | #311 | Tragic 17.0% |
| Immigrants | Somalia | 0.0 /100 | #312 | Tragic 17.0% |