Macedonian vs Spanish American Seniors Poverty Over the Age of 75
COMPARE
Macedonian
Spanish American
Seniors Poverty Over the Age of 75
Seniors Poverty Over the Age of 75 Comparison
Macedonians
Spanish Americans
11.4%
SENIORS POVERTY OVER THE AGE OF 75
95.5/ 100
METRIC RATING
78th/ 347
METRIC RANK
13.5%
SENIORS POVERTY OVER THE AGE OF 75
0.5/ 100
METRIC RATING
244th/ 347
METRIC RANK
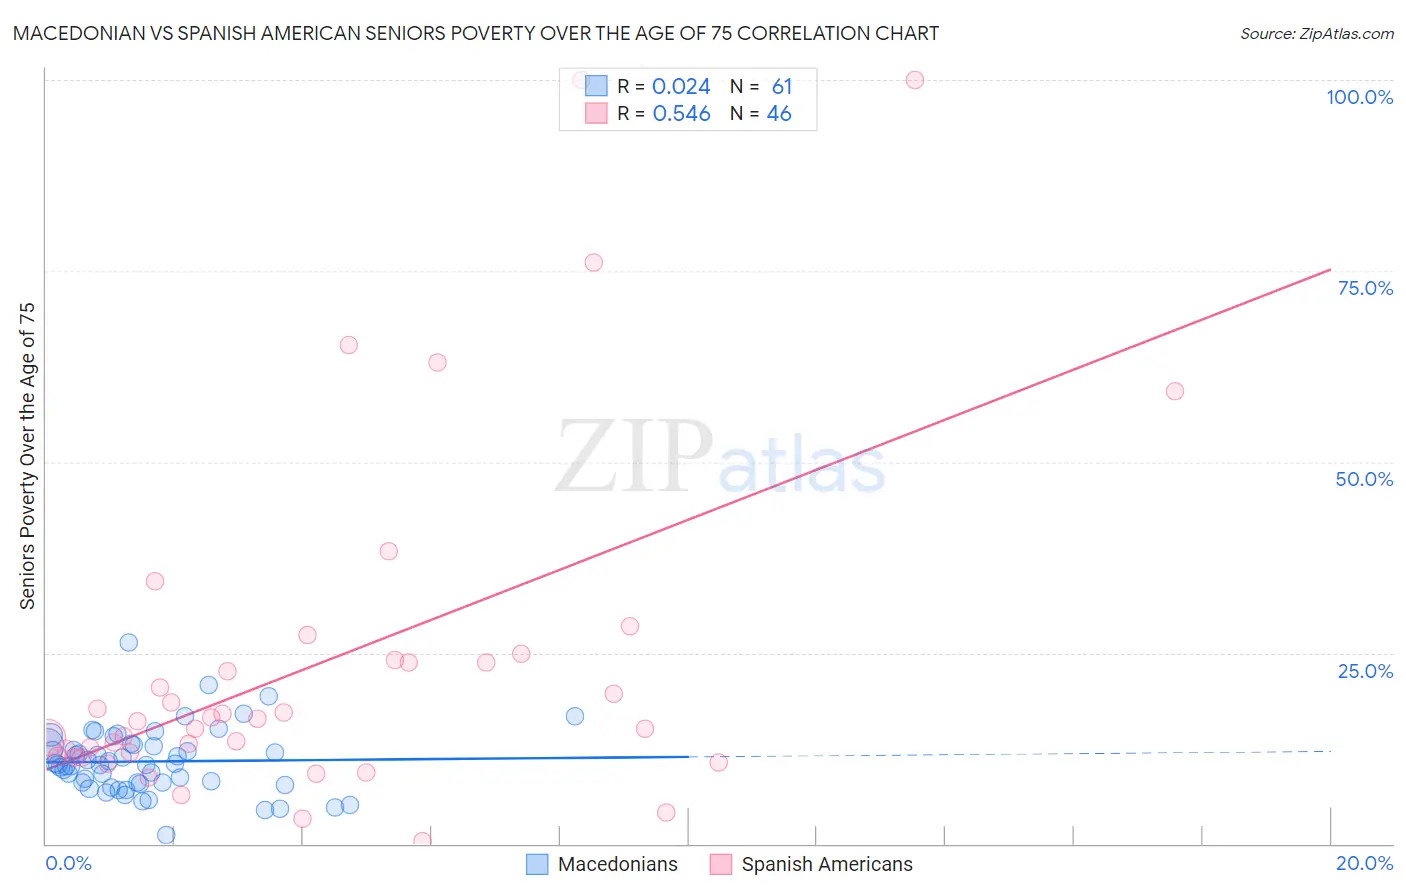
Macedonian vs Spanish American Seniors Poverty Over the Age of 75 Correlation Chart
The statistical analysis conducted on geographies consisting of 132,167,678 people shows no correlation between the proportion of Macedonians and poverty level among seniors over the age of 75 in the United States with a correlation coefficient (R) of 0.024 and weighted average of 11.4%. Similarly, the statistical analysis conducted on geographies consisting of 102,922,001 people shows a substantial positive correlation between the proportion of Spanish Americans and poverty level among seniors over the age of 75 in the United States with a correlation coefficient (R) of 0.546 and weighted average of 13.5%, a difference of 18.1%.
Seniors Poverty Over the Age of 75 Correlation Summary
| Measurement | Macedonian | Spanish American |
| Minimum | 1.2% | 0.28% |
| Maximum | 26.4% | 100.0% |
| Range | 25.2% | 99.7% |
| Mean | 10.8% | 24.0% |
| Median | 10.3% | 16.2% |
| Interquartile 25% (IQ1) | 7.9% | 11.5% |
| Interquartile 75% (IQ3) | 12.9% | 24.1% |
| Interquartile Range (IQR) | 5.0% | 12.6% |
| Standard Deviation (Sample) | 4.3% | 23.0% |
| Standard Deviation (Population) | 4.3% | 22.7% |
Similar Demographics by Seniors Poverty Over the Age of 75
Demographics Similar to Macedonians by Seniors Poverty Over the Age of 75
In terms of seniors poverty over the age of 75, the demographic groups most similar to Macedonians are Filipino (11.4%, a difference of 0.0%), White/Caucasian (11.4%, a difference of 0.010%), Alaska Native (11.4%, a difference of 0.060%), French Canadian (11.4%, a difference of 0.090%), and Palestinian (11.4%, a difference of 0.16%).
| Demographics | Rating | Rank | Seniors Poverty Over the Age of 75 |
| Osage | 96.3 /100 | #71 | Exceptional 11.4% |
| Sierra Leoneans | 96.1 /100 | #72 | Exceptional 11.4% |
| Immigrants | Micronesia | 96.0 /100 | #73 | Exceptional 11.4% |
| Delaware | 96.0 /100 | #74 | Exceptional 11.4% |
| Palestinians | 95.8 /100 | #75 | Exceptional 11.4% |
| French Canadians | 95.7 /100 | #76 | Exceptional 11.4% |
| Whites/Caucasians | 95.5 /100 | #77 | Exceptional 11.4% |
| Macedonians | 95.5 /100 | #78 | Exceptional 11.4% |
| Filipinos | 95.5 /100 | #79 | Exceptional 11.4% |
| Alaska Natives | 95.4 /100 | #80 | Exceptional 11.4% |
| Basques | 95.1 /100 | #81 | Exceptional 11.5% |
| Iranians | 95.1 /100 | #82 | Exceptional 11.5% |
| Immigrants | South Africa | 94.9 /100 | #83 | Exceptional 11.5% |
| Immigrants | Iraq | 94.9 /100 | #84 | Exceptional 11.5% |
| Immigrants | Bulgaria | 94.7 /100 | #85 | Exceptional 11.5% |
Demographics Similar to Spanish Americans by Seniors Poverty Over the Age of 75
In terms of seniors poverty over the age of 75, the demographic groups most similar to Spanish Americans are Uruguayan (13.5%, a difference of 0.14%), Dutch West Indian (13.5%, a difference of 0.32%), Immigrants from Somalia (13.5%, a difference of 0.34%), Immigrants from Cambodia (13.6%, a difference of 0.37%), and Immigrants from Russia (13.4%, a difference of 0.44%).
| Demographics | Rating | Rank | Seniors Poverty Over the Age of 75 |
| Alaskan Athabascans | 0.8 /100 | #237 | Tragic 13.4% |
| Peruvians | 0.8 /100 | #238 | Tragic 13.4% |
| Panamanians | 0.8 /100 | #239 | Tragic 13.4% |
| Argentineans | 0.7 /100 | #240 | Tragic 13.4% |
| Immigrants | Russia | 0.6 /100 | #241 | Tragic 13.4% |
| Immigrants | Somalia | 0.6 /100 | #242 | Tragic 13.5% |
| Dutch West Indians | 0.6 /100 | #243 | Tragic 13.5% |
| Spanish Americans | 0.5 /100 | #244 | Tragic 13.5% |
| Uruguayans | 0.5 /100 | #245 | Tragic 13.5% |
| Immigrants | Cambodia | 0.4 /100 | #246 | Tragic 13.6% |
| Immigrants | Ukraine | 0.3 /100 | #247 | Tragic 13.6% |
| Africans | 0.3 /100 | #248 | Tragic 13.6% |
| Immigrants | Albania | 0.3 /100 | #249 | Tragic 13.6% |
| Mexican American Indians | 0.3 /100 | #250 | Tragic 13.6% |
| Immigrants | Peru | 0.3 /100 | #251 | Tragic 13.7% |