Immigrants from El Salvador vs Yaqui Single Father Poverty
COMPARE
Immigrants from El Salvador
Yaqui
Single Father Poverty
Single Father Poverty Comparison
Immigrants from El Salvador
Yaqui
15.0%
SINGLE FATHER POVERTY
99.9/ 100
METRIC RATING
52nd/ 347
METRIC RANK
15.6%
SINGLE FATHER POVERTY
98.1/ 100
METRIC RATING
97th/ 347
METRIC RANK
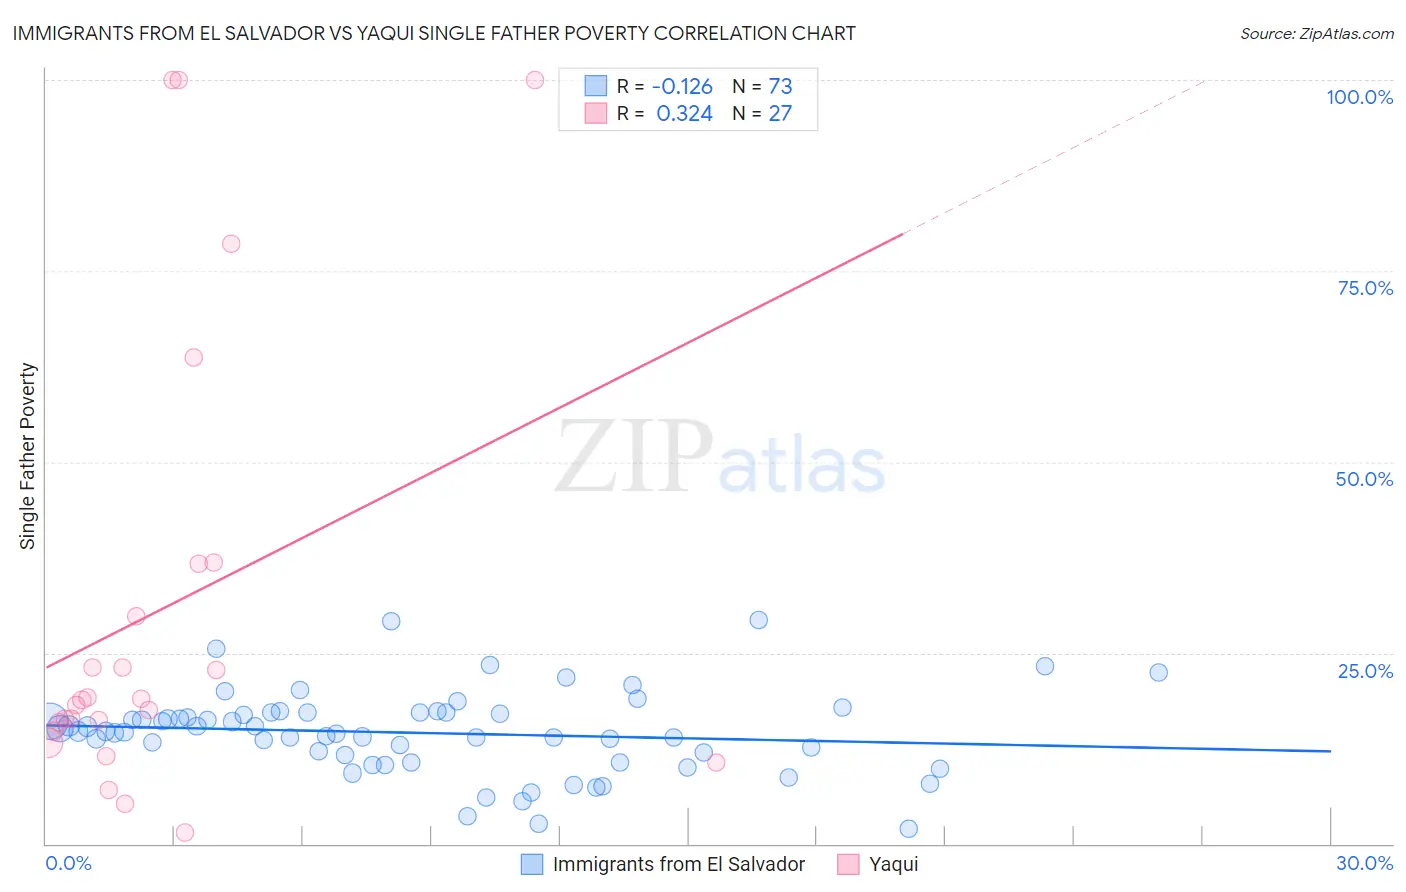
Immigrants from El Salvador vs Yaqui Single Father Poverty Correlation Chart
The statistical analysis conducted on geographies consisting of 292,495,730 people shows a poor negative correlation between the proportion of Immigrants from El Salvador and poverty level among single fathers in the United States with a correlation coefficient (R) of -0.126 and weighted average of 15.0%. Similarly, the statistical analysis conducted on geographies consisting of 98,465,633 people shows a mild positive correlation between the proportion of Yaqui and poverty level among single fathers in the United States with a correlation coefficient (R) of 0.324 and weighted average of 15.6%, a difference of 4.1%.
Single Father Poverty Correlation Summary
| Measurement | Immigrants from El Salvador | Yaqui |
| Minimum | 1.9% | 1.4% |
| Maximum | 29.3% | 100.0% |
| Range | 27.4% | 98.6% |
| Mean | 14.5% | 30.9% |
| Median | 14.7% | 18.8% |
| Interquartile 25% (IQ1) | 11.1% | 14.8% |
| Interquartile 75% (IQ3) | 17.2% | 36.7% |
| Interquartile Range (IQR) | 6.0% | 22.0% |
| Standard Deviation (Sample) | 5.4% | 29.8% |
| Standard Deviation (Population) | 5.3% | 29.2% |
Similar Demographics by Single Father Poverty
Demographics Similar to Immigrants from El Salvador by Single Father Poverty
In terms of single father poverty, the demographic groups most similar to Immigrants from El Salvador are Immigrants from Pakistan (15.0%, a difference of 0.040%), Immigrants from Kenya (15.0%, a difference of 0.040%), Bhutanese (15.0%, a difference of 0.060%), Immigrants from Eastern Asia (15.0%, a difference of 0.11%), and Immigrants from Uzbekistan (15.0%, a difference of 0.22%).
| Demographics | Rating | Rank | Single Father Poverty |
| Immigrants | Somalia | 100.0 /100 | #45 | Exceptional 14.9% |
| Immigrants | Cambodia | 99.9 /100 | #46 | Exceptional 14.9% |
| Immigrants | China | 99.9 /100 | #47 | Exceptional 14.9% |
| Malaysians | 99.9 /100 | #48 | Exceptional 14.9% |
| Immigrants | Eastern Asia | 99.9 /100 | #49 | Exceptional 15.0% |
| Bhutanese | 99.9 /100 | #50 | Exceptional 15.0% |
| Immigrants | Pakistan | 99.9 /100 | #51 | Exceptional 15.0% |
| Immigrants | El Salvador | 99.9 /100 | #52 | Exceptional 15.0% |
| Immigrants | Kenya | 99.9 /100 | #53 | Exceptional 15.0% |
| Immigrants | Uzbekistan | 99.9 /100 | #54 | Exceptional 15.0% |
| Immigrants | Bulgaria | 99.9 /100 | #55 | Exceptional 15.0% |
| Immigrants | Laos | 99.9 /100 | #56 | Exceptional 15.1% |
| Laotians | 99.9 /100 | #57 | Exceptional 15.1% |
| Hawaiians | 99.9 /100 | #58 | Exceptional 15.1% |
| Guamanians/Chamorros | 99.9 /100 | #59 | Exceptional 15.1% |
Demographics Similar to Yaqui by Single Father Poverty
In terms of single father poverty, the demographic groups most similar to Yaqui are Immigrants from Belgium (15.6%, a difference of 0.010%), Zimbabwean (15.6%, a difference of 0.010%), Immigrants from Kazakhstan (15.6%, a difference of 0.020%), Immigrants from Uruguay (15.6%, a difference of 0.070%), and Basque (15.5%, a difference of 0.21%).
| Demographics | Rating | Rank | Single Father Poverty |
| Mexican American Indians | 98.7 /100 | #90 | Exceptional 15.5% |
| Immigrants | Romania | 98.6 /100 | #91 | Exceptional 15.5% |
| Immigrants | Serbia | 98.5 /100 | #92 | Exceptional 15.5% |
| Basques | 98.4 /100 | #93 | Exceptional 15.5% |
| Immigrants | Uruguay | 98.2 /100 | #94 | Exceptional 15.6% |
| Immigrants | Kazakhstan | 98.2 /100 | #95 | Exceptional 15.6% |
| Immigrants | Belgium | 98.1 /100 | #96 | Exceptional 15.6% |
| Yaqui | 98.1 /100 | #97 | Exceptional 15.6% |
| Zimbabweans | 98.1 /100 | #98 | Exceptional 15.6% |
| Immigrants | Middle Africa | 97.4 /100 | #99 | Exceptional 15.6% |
| Immigrants | Chile | 96.9 /100 | #100 | Exceptional 15.7% |
| Fijians | 96.8 /100 | #101 | Exceptional 15.7% |
| Chileans | 96.4 /100 | #102 | Exceptional 15.7% |
| South American Indians | 96.2 /100 | #103 | Exceptional 15.7% |
| Australians | 96.1 /100 | #104 | Exceptional 15.7% |