Immigrants from Greece vs Immigrants from Lebanon Seniors Poverty Over the Age of 65
COMPARE
Immigrants from Greece
Immigrants from Lebanon
Seniors Poverty Over the Age of 65
Seniors Poverty Over the Age of 65 Comparison
Immigrants from Greece
Immigrants from Lebanon
10.6%
SENIORS POVERTY OVER THE AGE OF 65
79.0/ 100
METRIC RATING
147th/ 347
METRIC RANK
11.1%
SENIORS POVERTY OVER THE AGE OF 65
38.2/ 100
METRIC RATING
185th/ 347
METRIC RANK
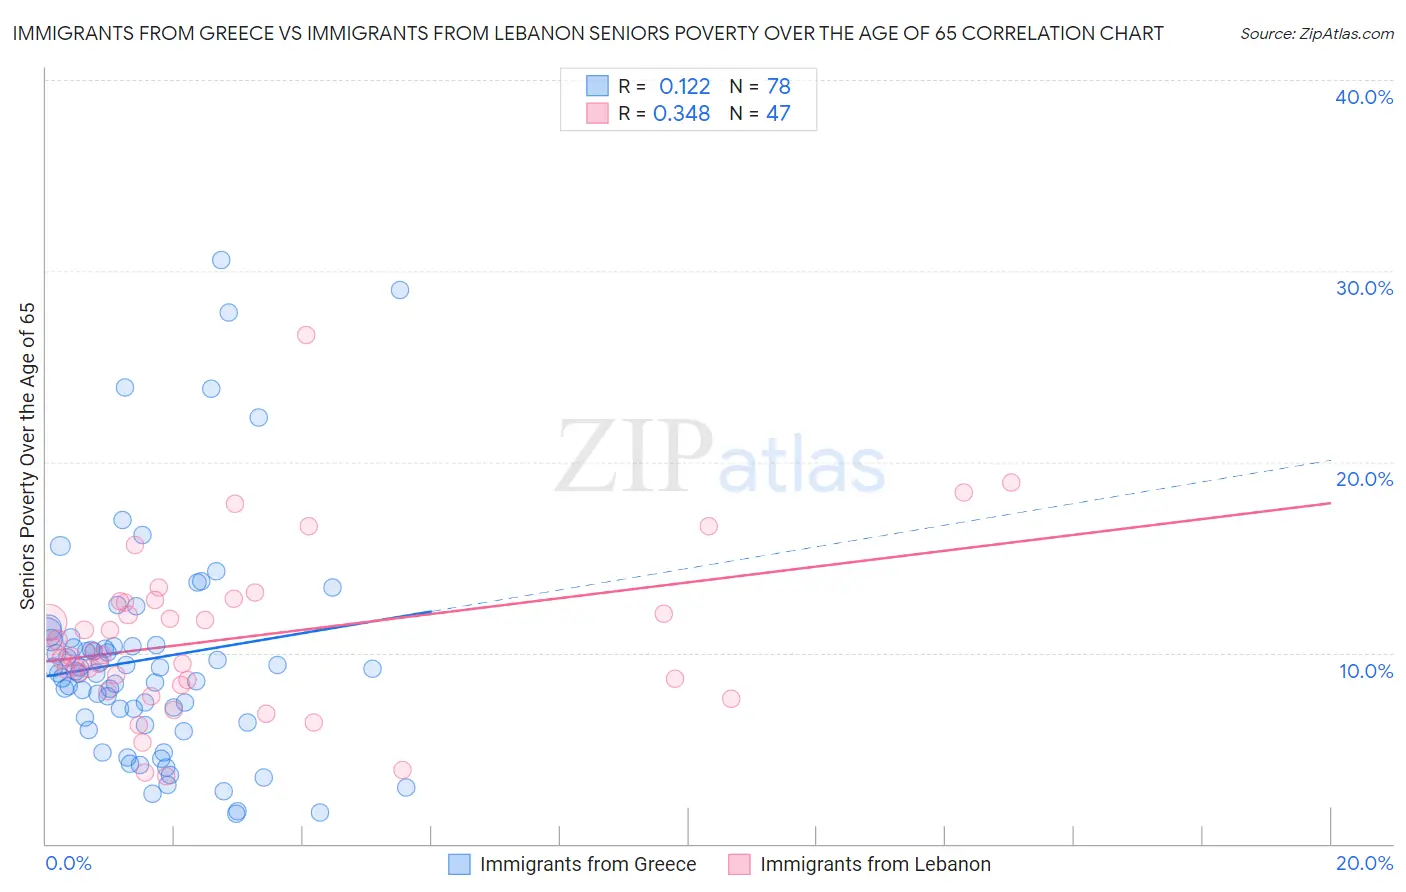
Immigrants from Greece vs Immigrants from Lebanon Seniors Poverty Over the Age of 65 Correlation Chart
The statistical analysis conducted on geographies consisting of 216,657,088 people shows a poor positive correlation between the proportion of Immigrants from Greece and poverty level among seniors over the age of 65 in the United States with a correlation coefficient (R) of 0.122 and weighted average of 10.6%. Similarly, the statistical analysis conducted on geographies consisting of 216,868,797 people shows a mild positive correlation between the proportion of Immigrants from Lebanon and poverty level among seniors over the age of 65 in the United States with a correlation coefficient (R) of 0.348 and weighted average of 11.1%, a difference of 4.1%.
Seniors Poverty Over the Age of 65 Correlation Summary
| Measurement | Immigrants from Greece | Immigrants from Lebanon |
| Minimum | 1.6% | 3.5% |
| Maximum | 30.6% | 26.7% |
| Range | 29.0% | 23.1% |
| Mean | 9.7% | 10.8% |
| Median | 9.0% | 9.9% |
| Interquartile 25% (IQ1) | 6.4% | 8.3% |
| Interquartile 75% (IQ3) | 10.4% | 12.7% |
| Interquartile Range (IQR) | 4.0% | 4.4% |
| Standard Deviation (Sample) | 5.9% | 4.3% |
| Standard Deviation (Population) | 5.9% | 4.3% |
Similar Demographics by Seniors Poverty Over the Age of 65
Demographics Similar to Immigrants from Greece by Seniors Poverty Over the Age of 65
In terms of seniors poverty over the age of 65, the demographic groups most similar to Immigrants from Greece are Alaskan Athabascan (10.6%, a difference of 0.020%), Laotian (10.6%, a difference of 0.12%), American (10.6%, a difference of 0.13%), Immigrants from Cameroon (10.6%, a difference of 0.13%), and Immigrants from Switzerland (10.6%, a difference of 0.23%).
| Demographics | Rating | Rank | Seniors Poverty Over the Age of 65 |
| Immigrants | Kenya | 83.4 /100 | #140 | Excellent 10.5% |
| Immigrants | Europe | 83.3 /100 | #141 | Excellent 10.5% |
| Osage | 82.8 /100 | #142 | Excellent 10.6% |
| Immigrants | Asia | 80.8 /100 | #143 | Excellent 10.6% |
| Iraqis | 80.7 /100 | #144 | Excellent 10.6% |
| Laotians | 79.9 /100 | #145 | Good 10.6% |
| Alaskan Athabascans | 79.1 /100 | #146 | Good 10.6% |
| Immigrants | Greece | 79.0 /100 | #147 | Good 10.6% |
| Americans | 78.1 /100 | #148 | Good 10.6% |
| Immigrants | Cameroon | 78.1 /100 | #149 | Good 10.6% |
| Immigrants | Switzerland | 77.3 /100 | #150 | Good 10.6% |
| Spanish | 76.8 /100 | #151 | Good 10.6% |
| Immigrants | Egypt | 76.5 /100 | #152 | Good 10.6% |
| Fijians | 75.6 /100 | #153 | Good 10.7% |
| Immigrants | Saudi Arabia | 74.9 /100 | #154 | Good 10.7% |
Demographics Similar to Immigrants from Lebanon by Seniors Poverty Over the Age of 65
In terms of seniors poverty over the age of 65, the demographic groups most similar to Immigrants from Lebanon are Immigrants from Eastern Asia (11.1%, a difference of 0.060%), Immigrants from Middle Africa (11.1%, a difference of 0.070%), Immigrants from Hong Kong (11.1%, a difference of 0.17%), Immigrants from Laos (11.1%, a difference of 0.23%), and Immigrants from Kazakhstan (11.0%, a difference of 0.25%).
| Demographics | Rating | Rank | Seniors Poverty Over the Age of 65 |
| German Russians | 46.9 /100 | #178 | Average 11.0% |
| Immigrants | Northern Africa | 44.6 /100 | #179 | Average 11.0% |
| Immigrants | Thailand | 43.5 /100 | #180 | Average 11.0% |
| Immigrants | Eastern Africa | 43.4 /100 | #181 | Average 11.0% |
| Immigrants | Fiji | 42.0 /100 | #182 | Average 11.0% |
| Immigrants | Kazakhstan | 41.0 /100 | #183 | Average 11.0% |
| Immigrants | France | 40.9 /100 | #184 | Average 11.0% |
| Immigrants | Lebanon | 38.2 /100 | #185 | Fair 11.1% |
| Immigrants | Eastern Asia | 37.5 /100 | #186 | Fair 11.1% |
| Immigrants | Middle Africa | 37.4 /100 | #187 | Fair 11.1% |
| Immigrants | Hong Kong | 36.3 /100 | #188 | Fair 11.1% |
| Immigrants | Laos | 35.7 /100 | #189 | Fair 11.1% |
| Indians (Asian) | 34.2 /100 | #190 | Fair 11.1% |
| Immigrants | Uganda | 32.2 /100 | #191 | Fair 11.1% |
| Immigrants | Southern Europe | 30.1 /100 | #192 | Fair 11.1% |