Immigrants from Ghana vs Immigrants from Eritrea Seniors Poverty Over the Age of 75
COMPARE
Immigrants from Ghana
Immigrants from Eritrea
Seniors Poverty Over the Age of 75
Seniors Poverty Over the Age of 75 Comparison
Immigrants from Ghana
Immigrants from Eritrea
14.4%
SENIORS POVERTY OVER THE AGE OF 75
0.0/ 100
METRIC RATING
271st/ 347
METRIC RANK
12.7%
SENIORS POVERTY OVER THE AGE OF 75
10.5/ 100
METRIC RATING
204th/ 347
METRIC RANK
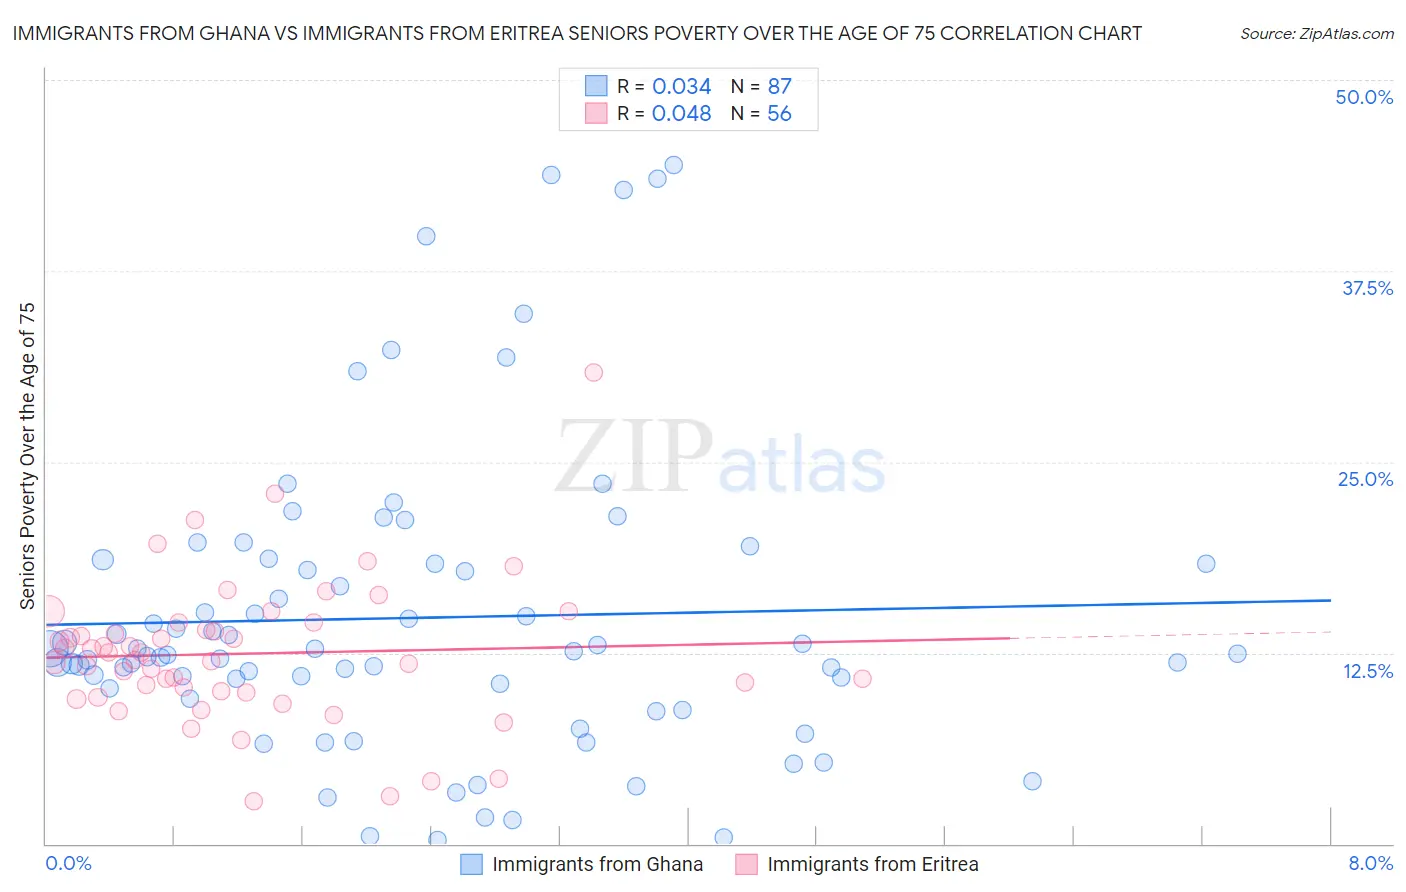
Immigrants from Ghana vs Immigrants from Eritrea Seniors Poverty Over the Age of 75 Correlation Chart
The statistical analysis conducted on geographies consisting of 198,360,562 people shows no correlation between the proportion of Immigrants from Ghana and poverty level among seniors over the age of 75 in the United States with a correlation coefficient (R) of 0.034 and weighted average of 14.4%. Similarly, the statistical analysis conducted on geographies consisting of 104,571,603 people shows no correlation between the proportion of Immigrants from Eritrea and poverty level among seniors over the age of 75 in the United States with a correlation coefficient (R) of 0.048 and weighted average of 12.7%, a difference of 12.9%.
Seniors Poverty Over the Age of 75 Correlation Summary
| Measurement | Immigrants from Ghana | Immigrants from Eritrea |
| Minimum | 0.23% | 2.8% |
| Maximum | 44.4% | 30.9% |
| Range | 44.2% | 28.1% |
| Mean | 14.8% | 12.4% |
| Median | 12.5% | 12.3% |
| Interquartile 25% (IQ1) | 10.2% | 10.0% |
| Interquartile 75% (IQ3) | 18.3% | 14.2% |
| Interquartile Range (IQR) | 8.2% | 4.3% |
| Standard Deviation (Sample) | 9.8% | 4.7% |
| Standard Deviation (Population) | 9.8% | 4.7% |
Similar Demographics by Seniors Poverty Over the Age of 75
Demographics Similar to Immigrants from Ghana by Seniors Poverty Over the Age of 75
In terms of seniors poverty over the age of 75, the demographic groups most similar to Immigrants from Ghana are Mexican (14.4%, a difference of 0.11%), Immigrants from South America (14.4%, a difference of 0.33%), Immigrants from Uruguay (14.3%, a difference of 0.48%), Immigrants from Bahamas (14.4%, a difference of 0.50%), and Immigrants from Venezuela (14.3%, a difference of 0.62%).
| Demographics | Rating | Rank | Seniors Poverty Over the Age of 75 |
| South Americans | 0.0 /100 | #264 | Tragic 14.1% |
| Salvadorans | 0.0 /100 | #265 | Tragic 14.2% |
| Armenians | 0.0 /100 | #266 | Tragic 14.2% |
| Venezuelans | 0.0 /100 | #267 | Tragic 14.2% |
| Colombians | 0.0 /100 | #268 | Tragic 14.3% |
| Immigrants | Venezuela | 0.0 /100 | #269 | Tragic 14.3% |
| Immigrants | Uruguay | 0.0 /100 | #270 | Tragic 14.3% |
| Immigrants | Ghana | 0.0 /100 | #271 | Tragic 14.4% |
| Mexicans | 0.0 /100 | #272 | Tragic 14.4% |
| Immigrants | South America | 0.0 /100 | #273 | Tragic 14.4% |
| Immigrants | Bahamas | 0.0 /100 | #274 | Tragic 14.4% |
| Immigrants | El Salvador | 0.0 /100 | #275 | Tragic 14.5% |
| Soviet Union | 0.0 /100 | #276 | Tragic 14.5% |
| Senegalese | 0.0 /100 | #277 | Tragic 14.5% |
| Immigrants | Colombia | 0.0 /100 | #278 | Tragic 14.6% |
Demographics Similar to Immigrants from Eritrea by Seniors Poverty Over the Age of 75
In terms of seniors poverty over the age of 75, the demographic groups most similar to Immigrants from Eritrea are Immigrants from Southern Europe (12.7%, a difference of 0.030%), Arapaho (12.7%, a difference of 0.090%), Paraguayan (12.7%, a difference of 0.12%), Indian (Asian) (12.7%, a difference of 0.16%), and Albanian (12.7%, a difference of 0.20%).
| Demographics | Rating | Rank | Seniors Poverty Over the Age of 75 |
| Nepalese | 14.4 /100 | #197 | Poor 12.6% |
| Chileans | 13.7 /100 | #198 | Poor 12.6% |
| Immigrants | Lebanon | 12.7 /100 | #199 | Poor 12.7% |
| Immigrants | Vietnam | 12.1 /100 | #200 | Poor 12.7% |
| Paraguayans | 11.1 /100 | #201 | Poor 12.7% |
| Arapaho | 10.9 /100 | #202 | Poor 12.7% |
| Immigrants | Southern Europe | 10.7 /100 | #203 | Poor 12.7% |
| Immigrants | Eritrea | 10.5 /100 | #204 | Poor 12.7% |
| Indians (Asian) | 9.7 /100 | #205 | Tragic 12.7% |
| Albanians | 9.6 /100 | #206 | Tragic 12.7% |
| Costa Ricans | 8.7 /100 | #207 | Tragic 12.8% |
| Immigrants | Eastern Asia | 8.4 /100 | #208 | Tragic 12.8% |
| Immigrants | Liberia | 7.3 /100 | #209 | Tragic 12.8% |
| Comanche | 7.0 /100 | #210 | Tragic 12.8% |
| Brazilians | 6.9 /100 | #211 | Tragic 12.8% |