Immigrants from Germany vs Immigrants from Kazakhstan Householder Income Under 25 years
COMPARE
Immigrants from Germany
Immigrants from Kazakhstan
Householder Income Under 25 years
Householder Income Under 25 years Comparison
Immigrants from Germany
Immigrants from Kazakhstan
$51,190
HOUSEHOLDER INCOME UNDER 25 YEARS
8.0/ 100
METRIC RATING
220th/ 347
METRIC RANK
$53,990
HOUSEHOLDER INCOME UNDER 25 YEARS
98.8/ 100
METRIC RATING
100th/ 347
METRIC RANK
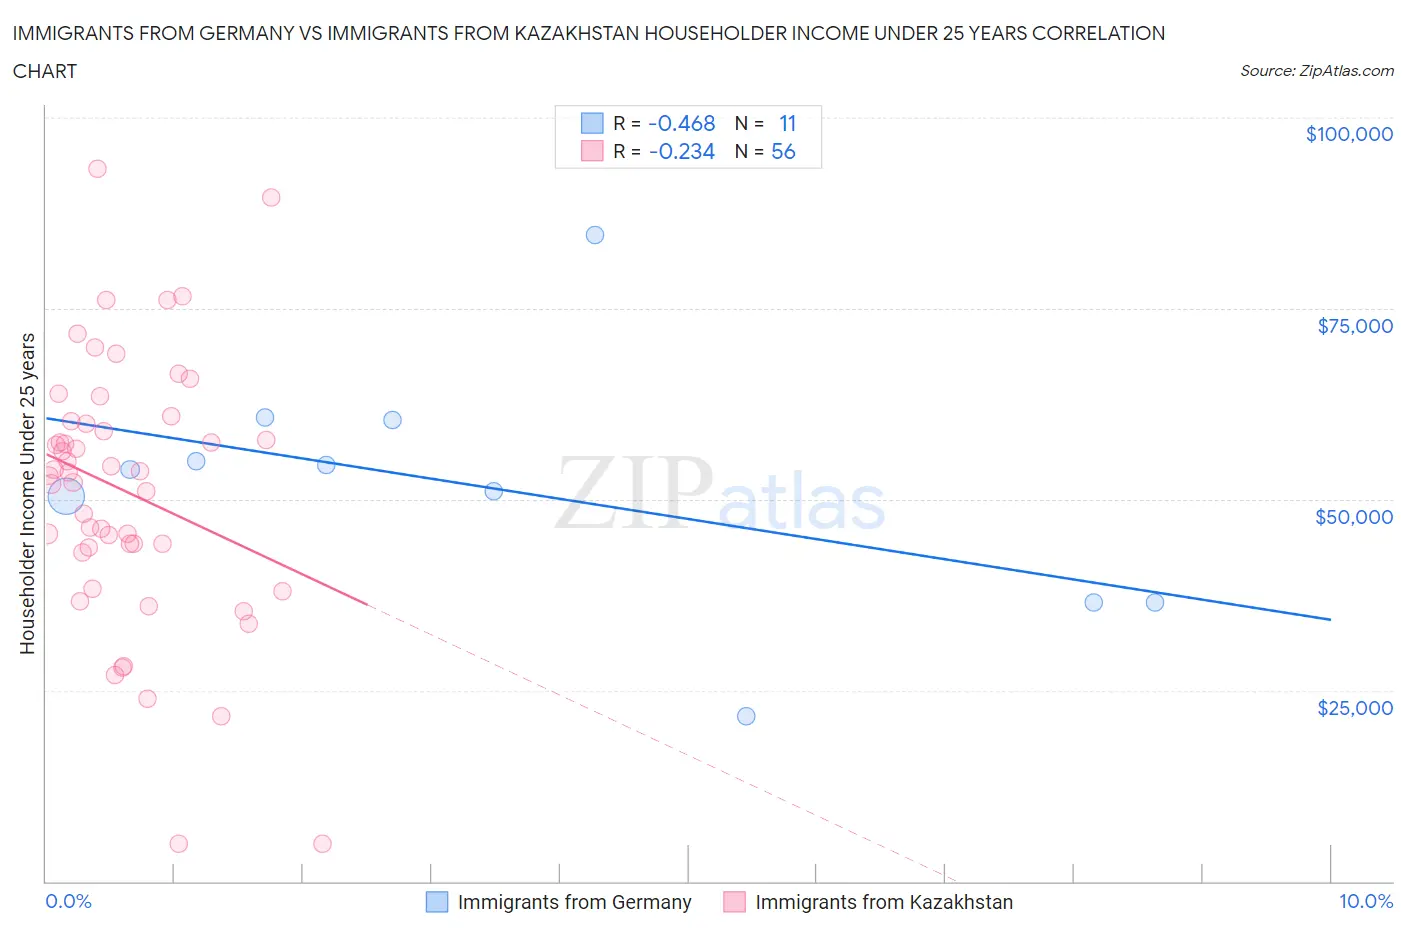
Immigrants from Germany vs Immigrants from Kazakhstan Householder Income Under 25 years Correlation Chart
The statistical analysis conducted on geographies consisting of 381,296,551 people shows a moderate negative correlation between the proportion of Immigrants from Germany and household income with householder under the age of 25 in the United States with a correlation coefficient (R) of -0.468 and weighted average of $51,190. Similarly, the statistical analysis conducted on geographies consisting of 113,998,482 people shows a weak negative correlation between the proportion of Immigrants from Kazakhstan and household income with householder under the age of 25 in the United States with a correlation coefficient (R) of -0.234 and weighted average of $53,990, a difference of 5.5%.
Householder Income Under 25 years Correlation Summary
| Measurement | Immigrants from Germany | Immigrants from Kazakhstan |
| Minimum | $21,627 | $4,881 |
| Maximum | $84,612 | $93,275 |
| Range | $62,985 | $88,394 |
| Mean | $51,378 | $50,957 |
| Median | $53,896 | $53,277 |
| Interquartile 25% (IQ1) | $36,563 | $43,364 |
| Interquartile 75% (IQ3) | $60,398 | $60,096 |
| Interquartile Range (IQR) | $23,835 | $16,732 |
| Standard Deviation (Sample) | $16,221 | $17,537 |
| Standard Deviation (Population) | $15,466 | $17,380 |
Similar Demographics by Householder Income Under 25 years
Demographics Similar to Immigrants from Germany by Householder Income Under 25 years
In terms of householder income under 25 years, the demographic groups most similar to Immigrants from Germany are Immigrants from Belize ($51,223, a difference of 0.060%), Arab ($51,219, a difference of 0.060%), Immigrants from Eastern Africa ($51,158, a difference of 0.060%), Czechoslovakian ($51,224, a difference of 0.070%), and French ($51,230, a difference of 0.080%).
| Demographics | Rating | Rank | Householder Income Under 25 years |
| Dutch | 9.4 /100 | #213 | Tragic $51,265 |
| Zimbabweans | 9.3 /100 | #214 | Tragic $51,259 |
| Icelanders | 9.1 /100 | #215 | Tragic $51,247 |
| French | 8.7 /100 | #216 | Tragic $51,230 |
| Czechoslovakians | 8.6 /100 | #217 | Tragic $51,224 |
| Immigrants | Belize | 8.6 /100 | #218 | Tragic $51,223 |
| Arabs | 8.5 /100 | #219 | Tragic $51,219 |
| Immigrants | Germany | 8.0 /100 | #220 | Tragic $51,190 |
| Immigrants | Eastern Africa | 7.4 /100 | #221 | Tragic $51,158 |
| Spaniards | 6.8 /100 | #222 | Tragic $51,117 |
| Serbians | 6.6 /100 | #223 | Tragic $51,106 |
| Belizeans | 6.4 /100 | #224 | Tragic $51,094 |
| Immigrants | Jamaica | 5.6 /100 | #225 | Tragic $51,038 |
| Yugoslavians | 5.5 /100 | #226 | Tragic $51,028 |
| Immigrants | Central America | 5.4 /100 | #227 | Tragic $51,022 |
Demographics Similar to Immigrants from Kazakhstan by Householder Income Under 25 years
In terms of householder income under 25 years, the demographic groups most similar to Immigrants from Kazakhstan are Alaska Native ($54,000, a difference of 0.020%), South American ($53,939, a difference of 0.090%), Eastern European ($54,066, a difference of 0.14%), Ecuadorian ($53,911, a difference of 0.15%), and Immigrants from Portugal ($54,105, a difference of 0.21%).
| Demographics | Rating | Rank | Householder Income Under 25 years |
| Immigrants | Argentina | 99.3 /100 | #93 | Exceptional $54,209 |
| Immigrants | Sierra Leone | 99.3 /100 | #94 | Exceptional $54,190 |
| Immigrants | Malaysia | 99.2 /100 | #95 | Exceptional $54,179 |
| Argentineans | 99.2 /100 | #96 | Exceptional $54,154 |
| Immigrants | Portugal | 99.1 /100 | #97 | Exceptional $54,105 |
| Eastern Europeans | 99.0 /100 | #98 | Exceptional $54,066 |
| Alaska Natives | 98.8 /100 | #99 | Exceptional $54,000 |
| Immigrants | Kazakhstan | 98.8 /100 | #100 | Exceptional $53,990 |
| South Americans | 98.6 /100 | #101 | Exceptional $53,939 |
| Ecuadorians | 98.5 /100 | #102 | Exceptional $53,911 |
| Ukrainians | 98.3 /100 | #103 | Exceptional $53,843 |
| Ethiopians | 98.2 /100 | #104 | Exceptional $53,818 |
| Immigrants | France | 98.1 /100 | #105 | Exceptional $53,805 |
| Albanians | 98.1 /100 | #106 | Exceptional $53,794 |
| Australians | 97.8 /100 | #107 | Exceptional $53,739 |