Immigrants from Fiji vs Jamaican Unemployment Among Women with Children Under 18 years
COMPARE
Immigrants from Fiji
Jamaican
Unemployment Among Women with Children Under 18 years
Unemployment Among Women with Children Under 18 years Comparison
Immigrants from Fiji
Jamaicans
5.7%
UNEMPLOYMENT AMONG WOMEN WITH CHILDREN UNDER 18 YEARS
6.3/ 100
METRIC RATING
220th/ 347
METRIC RANK
6.4%
UNEMPLOYMENT AMONG WOMEN WITH CHILDREN UNDER 18 YEARS
0.0/ 100
METRIC RATING
299th/ 347
METRIC RANK
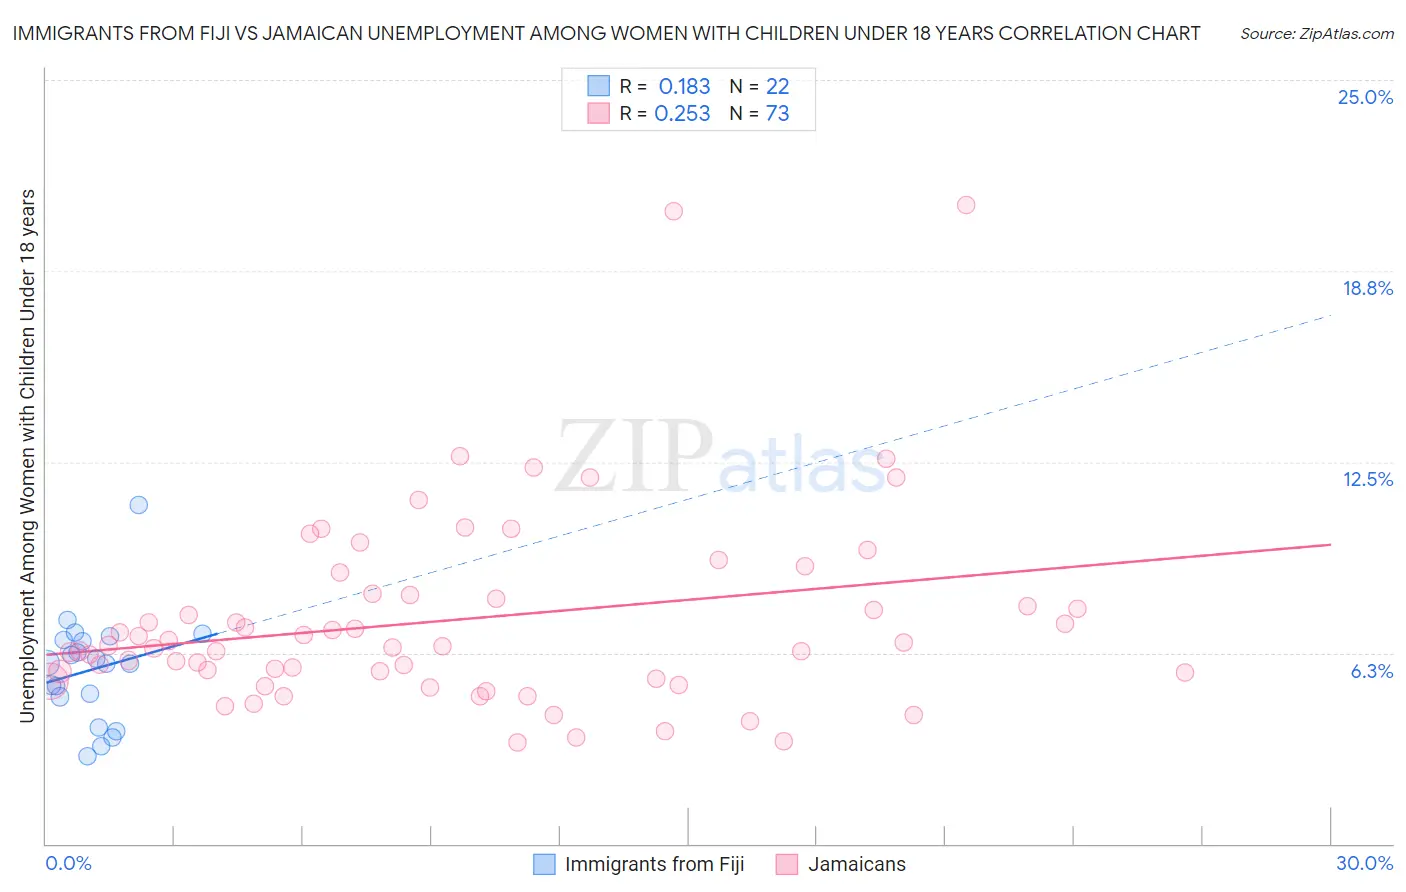
Immigrants from Fiji vs Jamaican Unemployment Among Women with Children Under 18 years Correlation Chart
The statistical analysis conducted on geographies consisting of 93,051,308 people shows a poor positive correlation between the proportion of Immigrants from Fiji and unemployment rate among women with children under the age of 18 in the United States with a correlation coefficient (R) of 0.183 and weighted average of 5.7%. Similarly, the statistical analysis conducted on geographies consisting of 356,105,986 people shows a weak positive correlation between the proportion of Jamaicans and unemployment rate among women with children under the age of 18 in the United States with a correlation coefficient (R) of 0.253 and weighted average of 6.4%, a difference of 12.6%.
Unemployment Among Women with Children Under 18 years Correlation Summary
| Measurement | Immigrants from Fiji | Jamaican |
| Minimum | 2.8% | 3.3% |
| Maximum | 11.1% | 20.9% |
| Range | 8.3% | 17.6% |
| Mean | 5.7% | 7.3% |
| Median | 5.9% | 6.5% |
| Interquartile 25% (IQ1) | 4.8% | 5.5% |
| Interquartile 75% (IQ3) | 6.7% | 8.2% |
| Interquartile Range (IQR) | 1.9% | 2.7% |
| Standard Deviation (Sample) | 1.8% | 3.2% |
| Standard Deviation (Population) | 1.8% | 3.2% |
Similar Demographics by Unemployment Among Women with Children Under 18 years
Demographics Similar to Immigrants from Fiji by Unemployment Among Women with Children Under 18 years
In terms of unemployment among women with children under 18 years, the demographic groups most similar to Immigrants from Fiji are Iroquois (5.7%, a difference of 0.060%), Pennsylvania German (5.7%, a difference of 0.18%), Immigrants from Nicaragua (5.7%, a difference of 0.19%), Immigrants from Brazil (5.7%, a difference of 0.22%), and Immigrants from Peru (5.7%, a difference of 0.30%).
| Demographics | Rating | Rank | Unemployment Among Women with Children Under 18 years |
| Americans | 8.9 /100 | #213 | Tragic 5.7% |
| Japanese | 8.7 /100 | #214 | Tragic 5.7% |
| Immigrants | Uganda | 7.9 /100 | #215 | Tragic 5.7% |
| Immigrants | Peru | 7.4 /100 | #216 | Tragic 5.7% |
| Immigrants | Brazil | 7.1 /100 | #217 | Tragic 5.7% |
| Immigrants | Nicaragua | 7.0 /100 | #218 | Tragic 5.7% |
| Iroquois | 6.5 /100 | #219 | Tragic 5.7% |
| Immigrants | Fiji | 6.3 /100 | #220 | Tragic 5.7% |
| Pennsylvania Germans | 5.7 /100 | #221 | Tragic 5.7% |
| Osage | 5.0 /100 | #222 | Tragic 5.7% |
| Potawatomi | 5.0 /100 | #223 | Tragic 5.7% |
| Immigrants | Syria | 4.6 /100 | #224 | Tragic 5.7% |
| Armenians | 4.5 /100 | #225 | Tragic 5.7% |
| Cherokee | 4.3 /100 | #226 | Tragic 5.7% |
| Sierra Leoneans | 3.8 /100 | #227 | Tragic 5.8% |
Demographics Similar to Jamaicans by Unemployment Among Women with Children Under 18 years
In terms of unemployment among women with children under 18 years, the demographic groups most similar to Jamaicans are Immigrants from Jamaica (6.4%, a difference of 0.14%), Immigrants from Haiti (6.4%, a difference of 0.19%), Immigrants from Latin America (6.4%, a difference of 0.30%), Immigrants from Armenia (6.5%, a difference of 0.44%), and Immigrants from Senegal (6.4%, a difference of 0.55%).
| Demographics | Rating | Rank | Unemployment Among Women with Children Under 18 years |
| Mexicans | 0.0 /100 | #292 | Tragic 6.4% |
| Immigrants | Bangladesh | 0.0 /100 | #293 | Tragic 6.4% |
| Hondurans | 0.0 /100 | #294 | Tragic 6.4% |
| Barbadians | 0.0 /100 | #295 | Tragic 6.4% |
| Haitians | 0.0 /100 | #296 | Tragic 6.4% |
| Immigrants | Senegal | 0.0 /100 | #297 | Tragic 6.4% |
| Immigrants | Latin America | 0.0 /100 | #298 | Tragic 6.4% |
| Jamaicans | 0.0 /100 | #299 | Tragic 6.4% |
| Immigrants | Jamaica | 0.0 /100 | #300 | Tragic 6.4% |
| Immigrants | Haiti | 0.0 /100 | #301 | Tragic 6.4% |
| Immigrants | Armenia | 0.0 /100 | #302 | Tragic 6.5% |
| Immigrants | Honduras | 0.0 /100 | #303 | Tragic 6.5% |
| Vietnamese | 0.0 /100 | #304 | Tragic 6.5% |
| Immigrants | Central America | 0.0 /100 | #305 | Tragic 6.5% |
| Immigrants | Guyana | 0.0 /100 | #306 | Tragic 6.5% |