Immigrants from Fiji vs Arab Seniors Poverty Over the Age of 75
COMPARE
Immigrants from Fiji
Arab
Seniors Poverty Over the Age of 75
Seniors Poverty Over the Age of 75 Comparison
Immigrants from Fiji
Arabs
12.2%
SENIORS POVERTY OVER THE AGE OF 75
51.5/ 100
METRIC RATING
172nd/ 347
METRIC RANK
12.2%
SENIORS POVERTY OVER THE AGE OF 75
50.5/ 100
METRIC RATING
173rd/ 347
METRIC RANK
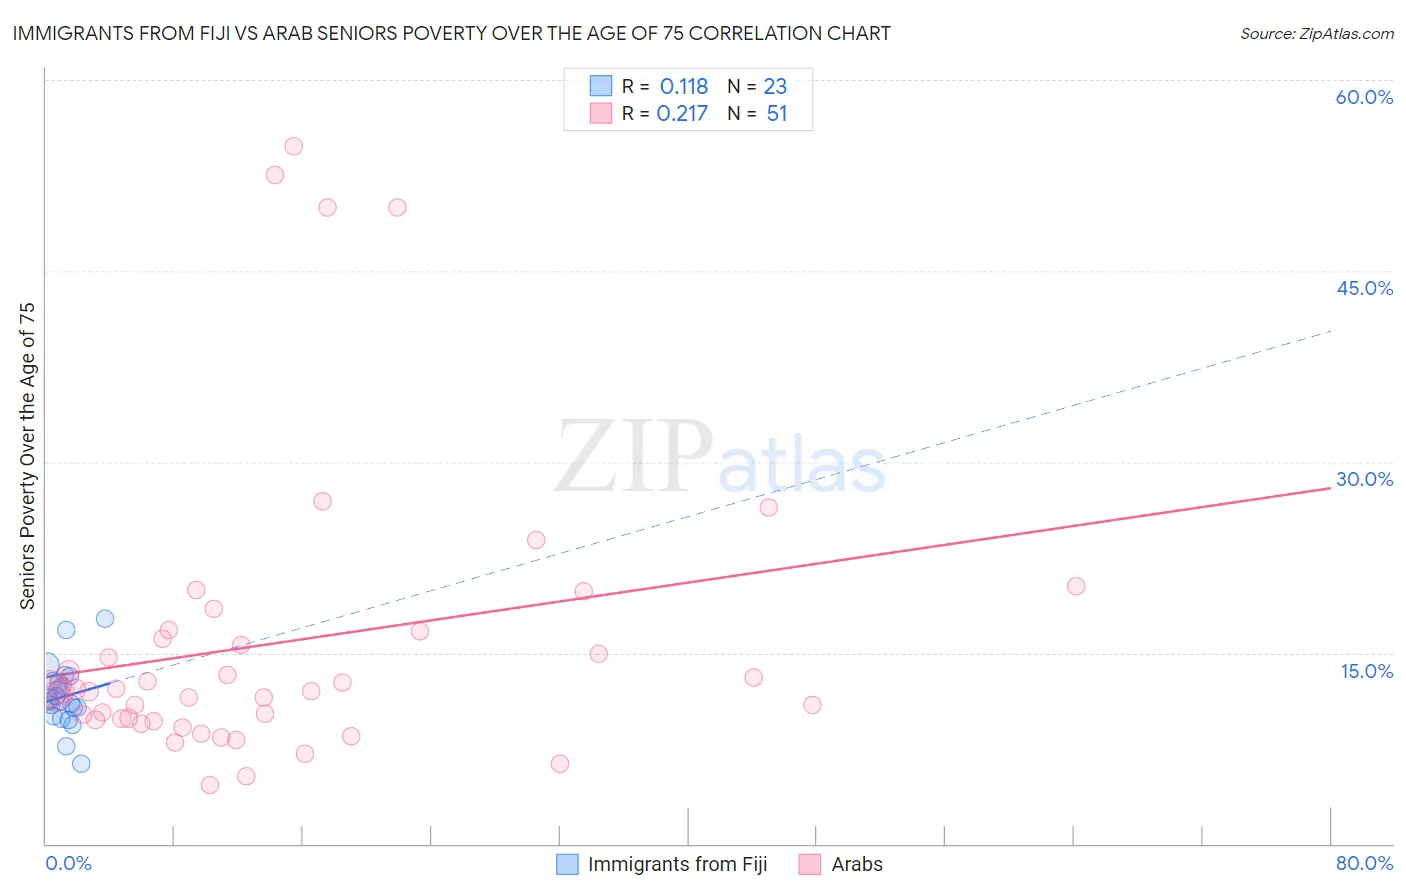
Immigrants from Fiji vs Arab Seniors Poverty Over the Age of 75 Correlation Chart
The statistical analysis conducted on geographies consisting of 93,526,881 people shows a poor positive correlation between the proportion of Immigrants from Fiji and poverty level among seniors over the age of 75 in the United States with a correlation coefficient (R) of 0.118 and weighted average of 12.2%. Similarly, the statistical analysis conducted on geographies consisting of 478,995,292 people shows a weak positive correlation between the proportion of Arabs and poverty level among seniors over the age of 75 in the United States with a correlation coefficient (R) of 0.217 and weighted average of 12.2%, a difference of 0.080%.
Seniors Poverty Over the Age of 75 Correlation Summary
| Measurement | Immigrants from Fiji | Arab |
| Minimum | 6.3% | 4.6% |
| Maximum | 17.7% | 54.8% |
| Range | 11.4% | 50.2% |
| Mean | 11.6% | 15.8% |
| Median | 11.2% | 12.0% |
| Interquartile 25% (IQ1) | 10.0% | 9.7% |
| Interquartile 75% (IQ3) | 12.8% | 16.7% |
| Interquartile Range (IQR) | 2.8% | 6.9% |
| Standard Deviation (Sample) | 2.5% | 11.7% |
| Standard Deviation (Population) | 2.5% | 11.6% |
Demographics Similar to Immigrants from Fiji and Arabs by Seniors Poverty Over the Age of 75
In terms of seniors poverty over the age of 75, the demographic groups most similar to Immigrants from Fiji are Spaniard (12.2%, a difference of 0.010%), Immigrants from Thailand (12.2%, a difference of 0.040%), Immigrants from Europe (12.2%, a difference of 0.12%), Immigrants from Saudi Arabia (12.2%, a difference of 0.17%), and Immigrants from Egypt (12.2%, a difference of 0.18%). Similarly, the demographic groups most similar to Arabs are Immigrants from Europe (12.2%, a difference of 0.040%), Immigrants from Saudi Arabia (12.2%, a difference of 0.080%), Spaniard (12.2%, a difference of 0.090%), Immigrants from Thailand (12.2%, a difference of 0.13%), and Immigrants from Iran (12.2%, a difference of 0.19%).
| Demographics | Rating | Rank | Seniors Poverty Over the Age of 75 |
| Immigrants | Serbia | 60.2 /100 | #162 | Good 12.1% |
| Immigrants | Greece | 58.2 /100 | #163 | Average 12.1% |
| Potawatomi | 57.4 /100 | #164 | Average 12.1% |
| Okinawans | 56.3 /100 | #165 | Average 12.1% |
| Egyptians | 54.8 /100 | #166 | Average 12.1% |
| Immigrants | Switzerland | 54.5 /100 | #167 | Average 12.1% |
| Immigrants | Syria | 53.9 /100 | #168 | Average 12.2% |
| Immigrants | Egypt | 53.7 /100 | #169 | Average 12.2% |
| Immigrants | Thailand | 52.0 /100 | #170 | Average 12.2% |
| Spaniards | 51.6 /100 | #171 | Average 12.2% |
| Immigrants | Fiji | 51.5 /100 | #172 | Average 12.2% |
| Arabs | 50.5 /100 | #173 | Average 12.2% |
| Immigrants | Europe | 50.0 /100 | #174 | Average 12.2% |
| Immigrants | Saudi Arabia | 49.5 /100 | #175 | Average 12.2% |
| Immigrants | Iran | 48.1 /100 | #176 | Average 12.2% |
| Immigrants | Asia | 47.8 /100 | #177 | Average 12.2% |
| Immigrants | Nonimmigrants | 46.8 /100 | #178 | Average 12.2% |
| Mongolians | 45.5 /100 | #179 | Average 12.2% |
| Immigrants | South Eastern Asia | 44.3 /100 | #180 | Average 12.2% |
| Immigrants | Australia | 44.2 /100 | #181 | Average 12.2% |
| German Russians | 41.4 /100 | #182 | Average 12.3% |